
T. Rowe Price in 2026: Defending Advisory Margins as Industry Dynamics Shift
T. Rowe Price’s Q3 2026 results highlight resilience amid market volatility and fee pressure, but the firm’s ability to sustain earnings growth will depend on navigating active-to-passive migration, optimizing expenses, and leveraging global and alternatives expansion.
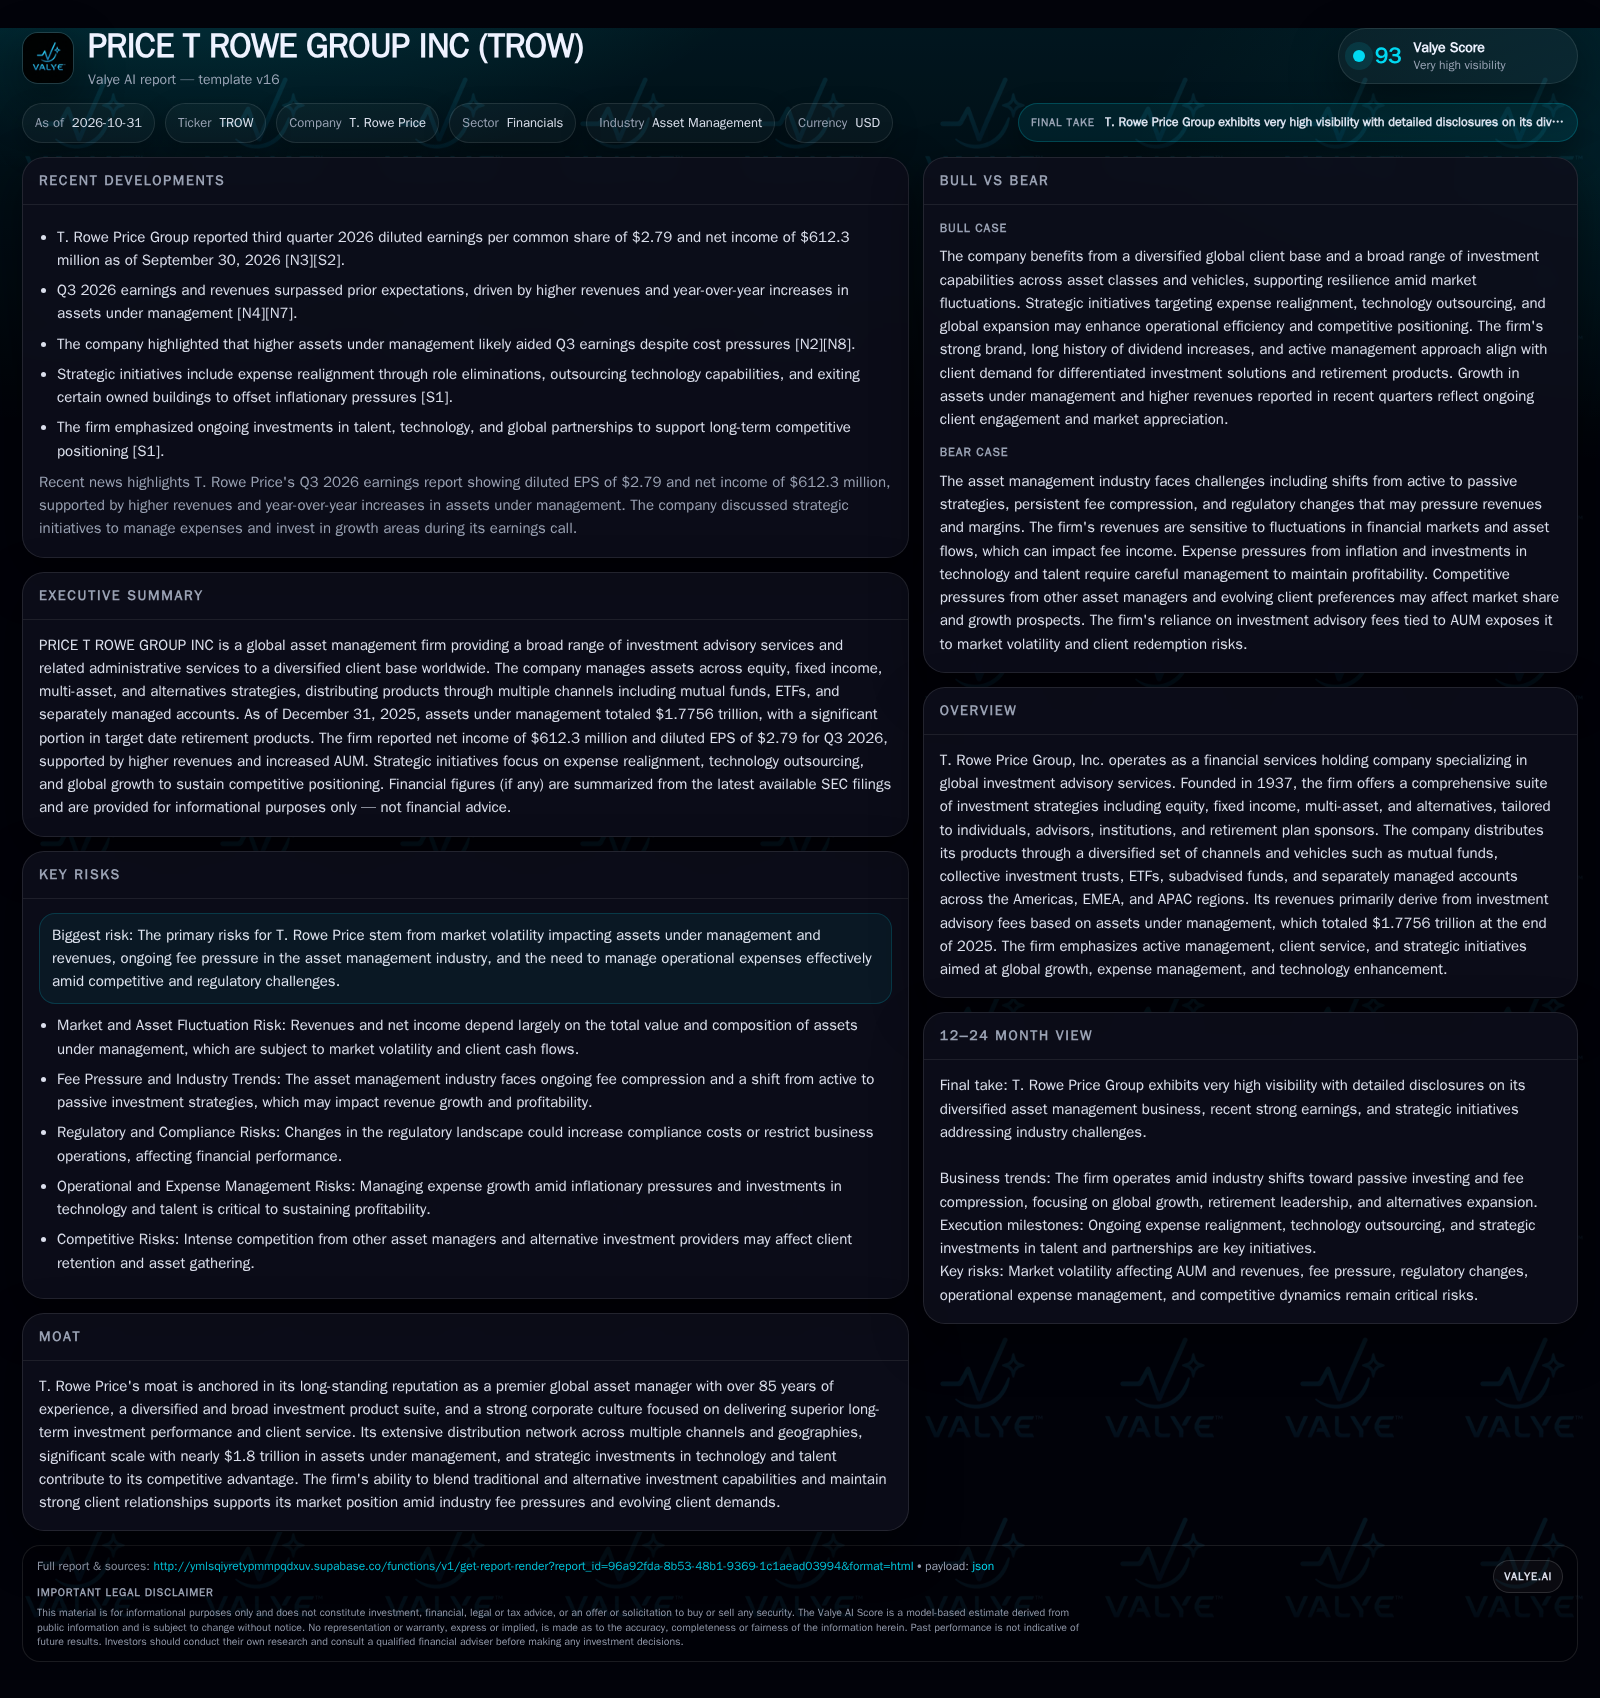
T. Rowe Price’s strong Q3 2026 earnings reflect higher assets under management and successful cost initiatives, but the core challenge remains defending advisory fee margins in a fee-compressing, increasingly passive investment landscape. Expense realignment, technology investments, and strategic global expansion are critical levers for maintaining competitive positioning as industry headwinds persist. The outcome will depend on AUM retention, product mix evolution, and the pace of operational adaptation. [S2] [N3] [N4] [S1]
T. Rowe Price’s latest results show it navigating the crosscurrents of asset management: robust Q3 2026 earnings and increased assets under management offset ongoing fee compression, changing client preferences, and inflationary cost pressures. With nearly $1.8 trillion in AUM and a prominent position in retirement products, the firm’s strategic initiatives—expense realignment, technology upgrades, and global expansion—are designed to defend margins and sustain growth. Yet, the fundamental question is whether these moves can preserve T. Rowe Price’s earnings power as active management faces secular headwinds and competition intensifies.
Earnings Momentum and Strategic Cost Actions Shape the Near-Term Landscape
T. Rowe Price delivered Q3 2026 net income of $612.3 million and diluted earnings per share of $2.79, exceeding prior expectations due to higher-than-anticipated revenues and year-over-year growth in assets under management. The company ended 2025 with $1.7756 trillion in AUM, of which $561.4 billion—31.6%—was in target date retirement products, underscoring its franchise in the retirement space. Management responded to inflationary and competitive pressures with strategic expense realignment, including role eliminations, outsourcing technology functions, and exiting certain owned properties. These actions are intended to preserve resources for ongoing investments in talent, technology, and global partnerships. [S2] [N3] [N4] [S1]
How Advisory Fee Economics Drive Profitability—and Where Pressure Builds
T. Rowe Price’s revenue model is almost entirely built on investment advisory fees, typically calculated as a percentage of assets under management. Roughly 55% of these fees are generated from U.S. mutual funds, with the remainder coming from collective trusts, ETFs, separately managed accounts, and other vehicles. This structure creates high operating leverage in rising markets or with positive net flows, but also amplifies downside risk during market corrections or client withdrawals. The firm’s fixed cost base—including personnel, technology infrastructure, and regulatory compliance—means that profitability is sensitive to both the level and mix of AUM. Expense realignment initiatives, such as outsourcing and real estate optimization, may help lower the break-even point, but persistent industry-wide fee compression and the ongoing shift from active to passive products could pressure revenue yields. The ability to grow in alternatives and global markets, where fee rates are typically higher or more stable, is increasingly important for sustaining margins.
Given the fee-sensitive nature of T. Rowe Price’s revenue base, the firm’s profitability is intricately linked to how effectively it can manage the balance between asset growth and fee compression. If market conditions remain volatile or if passive products continue to gain share, the firm’s ability to sustain or raise fees on new and existing assets becomes crucial. Additionally, the product mix shift toward alternatives and global mandates introduces different fee structures and risk-return profiles, which can either mitigate or exacerbate margin pressures depending on client demand and competitive pricing. A useful metric would be the firm’s blended fee yield trend over time, adjusted for currency effects in global markets, to isolate the impact of product and regional shifts on revenue quality.
Defending Share in a Fee-Compressing, Passive-Heavy Asset Management Industry
T. Rowe Price’s competitive positioning rests on its scale, reputation for active management, and longstanding relationships in retirement and intermediary channels. However, the industry is seeing accelerating flows into passive products—primarily index funds and ETFs—which tend to offer lower fees and are dominated by a small number of mega-scale competitors. While T. Rowe Price has diversified into collective trusts and ETFs, its core revenue stream is still heavily reliant on actively managed mutual funds. The firm’s ability to innovate in product design (especially in target date and alternatives), deepen its global client base, and deliver strong investment performance are critical to retaining and growing AUM. Competition comes not only from traditional asset managers but also from low-cost index providers, digital investment platforms, and alternative asset managers targeting institutional and high-net-worth clients.
The competitive landscape’s evolution towards passive and digital channels necessitates that T. Rowe Price not only defend its traditional active management franchises but also innovate in client engagement and product delivery. The firm’s scale offers advantages in distribution and operational efficiency, but these must be leveraged against nimble digital-first entrants and low-cost providers. Strategic partnerships and technology investments could enable more personalized advice and seamless client experiences, which are increasingly valued in wealth management. However, the cost and complexity of integrating new platforms and maintaining compliance across jurisdictions may constrain speed and scale. The firm’s ability to demonstrate consistent alpha generation relative to passive alternatives will remain a critical differentiator to justify higher fees and retain clients.
If Alternatives and Global Expansion Outpace Fee Compression
A favorable outcome for T. Rowe Price would see its investments in alternatives and global distribution translating into higher-margin asset growth, offsetting the drag from fee compression in core mutual funds. If the firm can capture incremental share in non-U.S. markets—where it currently sources only about 9% of AUM—and accelerate flows into alternatives and retirement solutions, the overall fee rate could stabilize or even improve. Continued success in digital client experience and reporting could also help attract and retain higher-value clients. Evidence confirming this scenario would include sustained positive net flows in alternatives and global products, stabilization or improvement in blended fee rates, and margin expansion despite industry headwinds.
Balancing Fee Compression with Incremental Efficiency Gains
The most plausible trajectory is one where T. Rowe Price continues to face moderate fee pressure as clients migrate toward passive and lower-cost products, while operational expense controls partially offset the margin impact. AUM growth may be driven by market appreciation and modest net inflows in retirement and alternatives, but the overall revenue yield on assets is likely to decline gradually. Margins could remain stable if efficiency initiatives are executed effectively and if investment performance remains competitive, but earnings growth would be largely dependent on favorable market conditions. Confirmation of this scenario would be gradual declines in average fee rates, steady but unspectacular AUM growth, and limited margin erosion.
Market Volatility and Accelerating Outflows Expose Structural Risks
A more adverse scenario would see market volatility triggering significant AUM declines, compounded by client outflows from active strategies. If fee compression accelerates or if T. Rowe Price underperforms in key strategies, revenues could fall faster than expenses can be adjusted, leading to margin contraction. The inability to scale alternatives and global offerings, or failure to keep pace with digital innovation, could further erode the firm’s competitive position. Signs confirming this scenario would include sharp drops in AUM, negative net flows across major product lines, rapid declines in fee rates, and a widening gap between revenue and expense growth.
What Will Determine T. Rowe Price’s Earnings Power Over the Next Cycle?
Net client flows by asset class and channel—especially in alternatives, retirement, and international mandates—would help test the sustainability of AUM growth if disclosed.
Blended fee rate trends, including the impact of product mix shifts, are critical for understanding future revenue trajectories.
Expense run-rate and progress on strategic cost initiatives such as technology outsourcing and real estate optimization should be tracked for margin impact.
Market share evolution in retirement solutions and collective investment trusts would indicate competitive strength in core franchises.
Investment performance metrics, especially relative to passive benchmarks and peers, directly influence retention and asset gathering.
Growth rates in non-U.S. AUM and success of global distribution partnerships would signal progress in diversification.
Adoption and fee economics of new products—such as alternatives and digital solutions—are key for offsetting pressures in legacy mutual fund lines.
Turnover in senior investment and distribution talent could affect client relationships and franchise stability if disclosed.
Disclaimer: This is research-only, informational analysis and not investment advice. It may include AI-generated interpretation and general industry context. Always verify important details using primary sources.

Comments