
Under Armour Strengthens Operational Efficiency with Cost Restructuring and International Growth
Recent quarterly filings highlight Under Armour’s expanded restructuring plan and robust international sales as key elements in its operational turnaround.
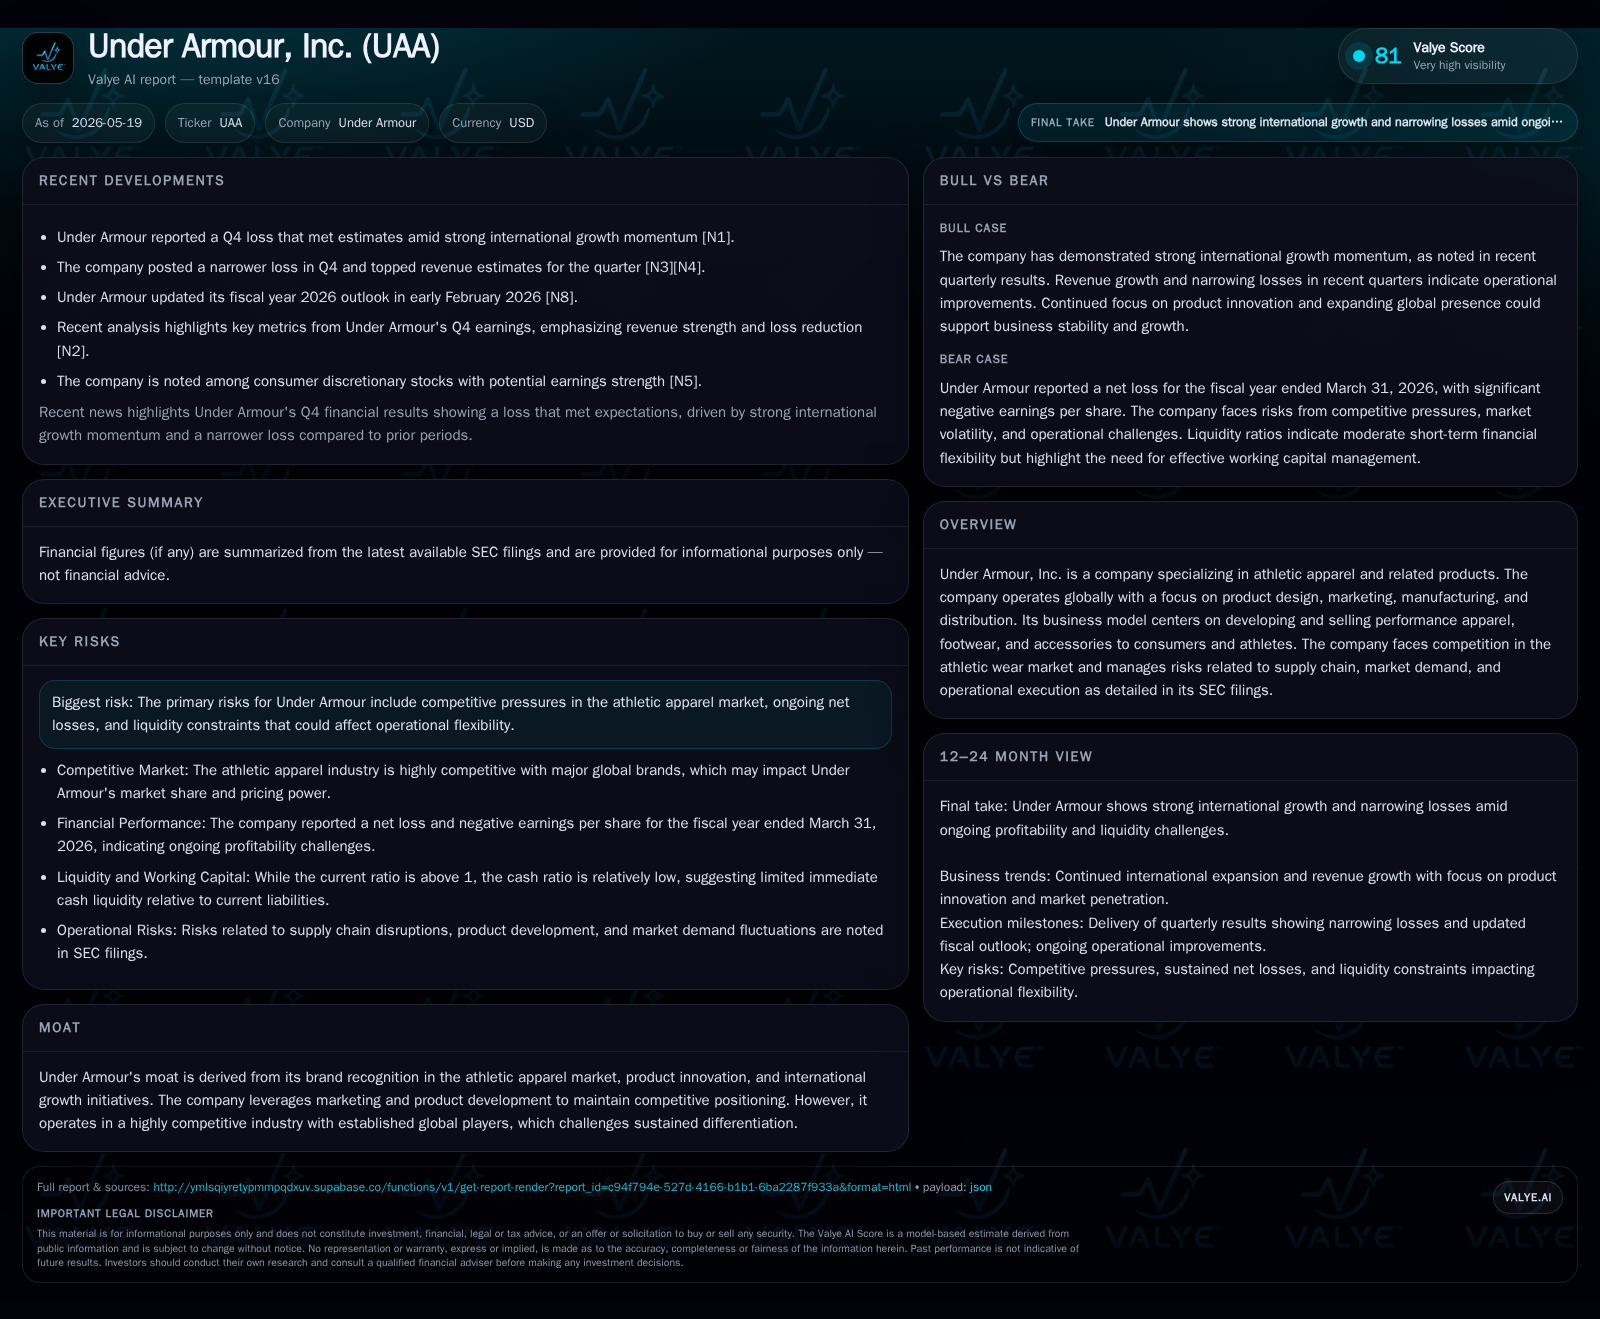
Under Armour’s latest 10-Q filing reveals an increase in its fiscal year 2025 restructuring charges to $305 million, aiming to enhance financial and operational efficiency. Despite ongoing net losses, the company reported revenue that topped expectations, driven largely by strong momentum in international markets. The business continues to navigate a highly competitive athletic apparel industry by leveraging product innovation and global expansion while managing significant risks related to liquidity and competitive pressures. Key near-term milestones include completing restructuring initiatives by the end of 2026 and sustaining international sales growth.
Latest Quarterly Operating Update: Restructuring and Revenue Dynamics
Under Armour’s latest quarterly disclosure dated February 6, 2026 (10-Q) spotlights an escalated restructuring initiative as a central component of its strategy to restore operational efficiency [S3]. Originally targeted at $255 million in pre-tax charges for fiscal year 2025, the plan was revised upward by the Board in early May to approximately $305 million. This includes a cash component estimated at $139 million—predominantly employee severance and benefits (around $46 million) plus transformative initiatives—and non-cash charges totaling roughly $166 million primarily linked to contract terminations and asset impairments
As of the quarter ending March 31, 2026, Under Armour has booked about $261 million of these costs ($109 million cash-based), underscoring material near-term expense headwinds but signaling progress toward completion aimed by December 31, 2026 [S3]. Despite these restructuring headwinds impacting profitability, revenue performance notably outpaced analyst estimates in Q4 fiscal 2026. This top-line resilience owes much to accelerated international sales momentum reflecting expanding footprint beyond traditional North American markets [N2], highlighting geographic diversification as an emerging strength.
While operating income remained negative reflective of ongoing restructuring impacts and competitive pressures on margins, the firm emphasizes that these transformational activities are creating a platform for sustainable growth through improved cost structure and enhanced brand relevance across channels [S2]
Business Model and Product Offering Analysis
Under Armour operates primarily in the athletic apparel space with complementary offerings in footwear and accessories. The company’s revenue mechanics revolve around designing high-performance products delivered through wholesale channels (sporting goods retailers), direct-to-consumer platforms including e-commerce and branded stores, alongside licensing agreements. Customers range from everyday fitness enthusiasts to professional athletes demanding technical innovation.
The firm’s strategic product development focuses on proprietary fabrics and designs positioned around moisture-wicking technology, durability, and style appeal—critical differentiators that support premium pricing within a saturated marketplace. Marketing investments target visibility via professional athlete endorsements and sports events sponsorships to deepen consumer engagement.
Supply chain orchestration includes global manufacturing partnerships supplemented by rigorous quality assurance processes to ensure consistent product standards. Inventory management balances seasonal fashion cycles with demand forecasting complexities that have historically posed challenges but are addressed through improved analytics [S1].
Competitive Environment and Industry Structure
Under Armour competes against well-entrenched giants such as Nike and Adidas that command substantial scale advantages in production capacity, brand equity, and omnichannel distribution networks. This environment exerts downward pressure on pricing power and creates barriers for smaller-scale initiatives within certain segments.
Industry dynamics feature customer loyalty nuances driven by switching costs linked to brand affinity but also price sensitivity amidst economic fluctuations affecting discretionary spending. Retail channel shifts toward digital sales require continuous investment in technological capabilities to sustain consumer touchpoints.
The company must also navigate capacity constraints accelerated by global supply chain disruptions impacting raw material availability and freight costs [S9]. Strategic prowess lies in maintaining innovative product pipelines while controlling operational costs within this fiercely competitive landscape
Growth Drivers: International Expansion and Innovation
Recent quarterly data affirm international markets as a pivotal growth engine for Under Armour. Its push into regions such as Europe, Asia-Pacific, and Latin America leverages tailored marketing campaigns aligned with local athlete partnerships to build brand awareness. The broader geographical distribution mitigates reliance on the North American market which has matured significantly.
Innovation pipelines centered on next-generation fabric technologies blend performance enhancements with sustainability goals—emerging consumer priorities globally. These innovations enable product differentiation critical for premium pricing strategies.
Further growth facilitation arises from digital commerce enhancements improving customer experience via personalized offerings and improved logistics capabilities allowing for faster delivery times internationally [N14], fostering higher retention rates.
Risk Factors and Operational Constraints
Despite strategic advancements, Under Armour faces notable risks:
- The company continues to report net losses stemming partly from restructuring-related expenses alongside elevated selling general & administrative (SG&A) outlays necessary for brand building efforts [S2].
- Liquidity pressure is apparent given large net debt approximating $890 million against cash reserves near $309 million at fiscal Q4 end [F1], restricting financial flexibility amid uncertain macroeconomic conditions.
- Competitive intensity remains elevated with margin compression potential if price competition intensifies or innovation cycles falter.
- Supply chain vulnerabilities tied to global commodity pricing fluctuations or logistic interruptions present persistent operational risks impacting inventory turnover velocity.
- Regulatory compliance demands especially regarding sustainability initiatives introduce additional cost layers potentially affecting product cost structures long term [S9].
Investor Watchlist: Near-Term Milestones and Market Indicators
Investors should monitor several critical markers over the upcoming quarters:
- Execution progress on restructuring plan completion slated by end-2026 including transparency around final charge realizations.
- Continuation of double-digit international sales growth rates signaling effective market penetration.
- Improvements in operating margins reflecting successful cost controls post-restructuring.
- Release of updated guidance metrics providing visibility into anticipated shifts in profitability trajectory.
- Launch cadence for innovative products meeting evolving consumer preferences supporting pricing power retention.
Near-term earnings announcements will be particularly scrutinized for signs of stabilized losses or narrowing negative net income trends.
Concise Financial Overview
For the fiscal year ended March 31, 2026, Under Armour generated revenues close to $4.97 billion but recorded an operating loss exceeding $163 million [F1]. The bottom line reflected a wider net loss nearing $496 million driven largely by non-cash restructuring expenses recorded during this period
Liquidity metrics reveal cash & equivalents standing at approximately $309 million against total debt close to $1.2 billion resulting in a current ratio of about 1.62 as quarter-end—all signaling moderate short-term liquidity though substantial leverage remains a flagship concern constraining financial agility [F1]
Efforts continue to improve cost structures while scaling international operations aim at turning top-line growth into profitable operating leverage during FY27 onward.
This analysis reflects information available through May 19, 2026 filings without providing investment advice or research views.
Disclaimer: This is research-only, informational analysis and not investment advice. It may include AI-generated interpretation and general industry context. Always verify important details using primary sources.

Comments