
Vylor Inc.: Post-Spin-Off Uncertainty, S&P 500 Entry, and the Stakes of Business Model Clarity
Vylor Inc. debuts as a major public company following its spin-off from Corteva, reporting significant revenue but steep losses amid limited business model disclosure. With S&P 500 inclusion and active analyst attention, investor focus turns to profitability drivers, risk management, and the need for greater operational transparency.
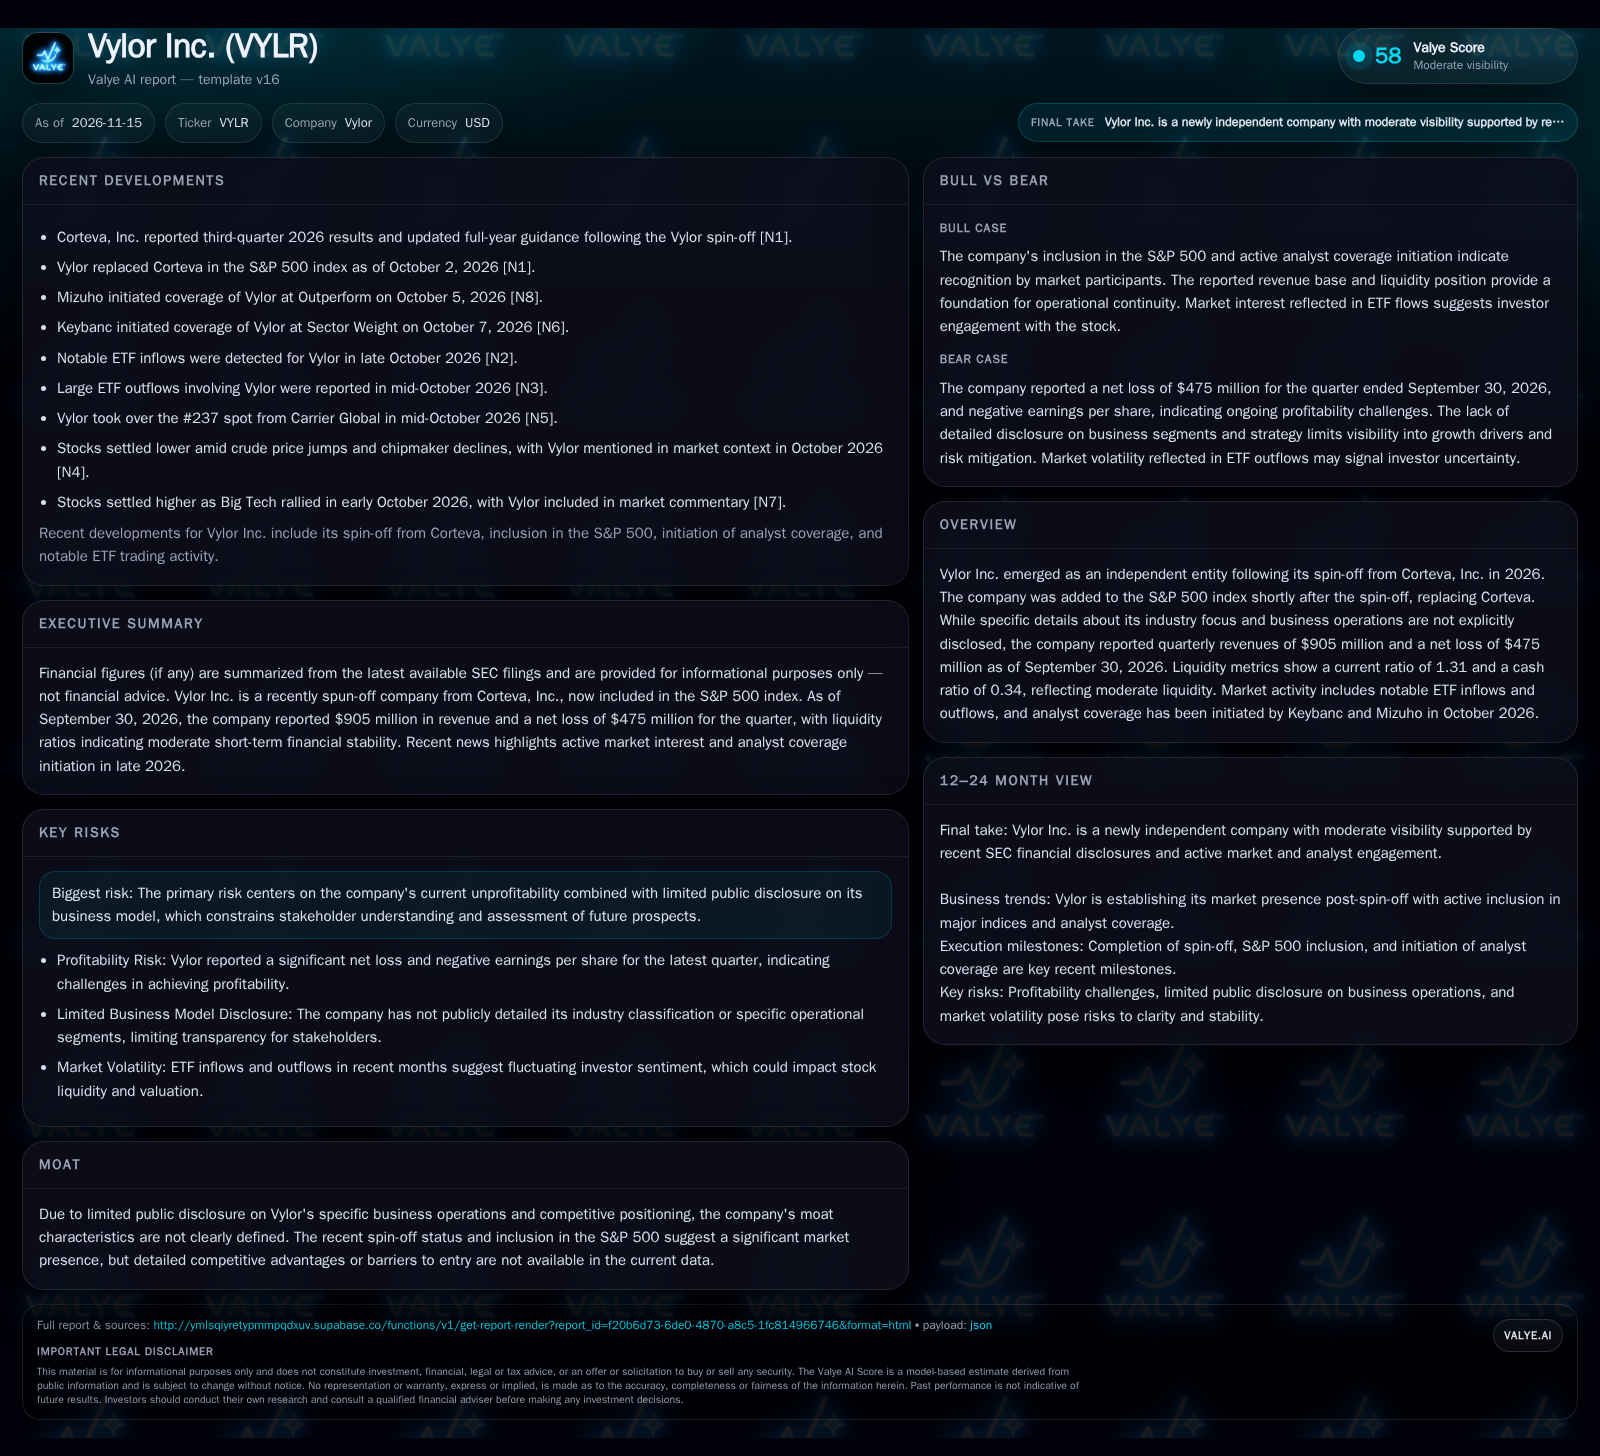
Vylor Inc. emerged as an independent public company in late 2026 after spinning off from Corteva, quickly joining the S&P 500 and attracting analyst coverage. Despite $905 million in quarterly revenue, the company posted a $475 million net loss and has yet to disclose clear details about its business model or industry focus. Recent ETF inflows and outflows point to active investor interest but also heightened uncertainty about Vylor’s future direction and value proposition. [S1] [N1] [N2] [N3] [N6] [N8]
Vylor Inc. enters the public markets as a newly independent company carved out from Corteva, immediately securing a place in the S&P 500 and drawing attention from both analysts and ETF investors. Despite this high-profile debut, the company’s lack of clear disclosure about its core business activities leaves a gap in understanding the mechanics behind its $905 million in quarterly revenue and steep net loss.
Spin-Off, S&P 500 Induction, and the Financial Reality
Vylor Inc. was spun off from Corteva, Inc. in late 2026, becoming an independent public company and replacing Corteva in the S&P 500 as of October 2, 2026. For the quarter ending September 30, 2026, Vylor reported $905 million in revenue against a net loss of $475 million, translating to negative $0.85 in basic and diluted EPS. As of the same date, the company held $2.21 billion in cash and cash equivalents and had total current assets of $8.52 billion versus $6.481 billion in current liabilities, resulting in a current ratio of 1.31 and a cash ratio of 0.34. The company reported cash and liquidity metrics for the period; these figures do not by themselves establish operating runway, investment capacity, financial flexibility, or financing capacity. The addition to the S&P 500 has catalyzed both ETF inflows and outflows, reflecting heightened investor scrutiny and volatility. [S1] [N1] [N2] [N3] [N5]
Beyond the headline liquidity ratios, a more nuanced assessment of Vylor's financial position would consider the composition and quality of current assets and liabilities. For instance, if a significant portion of current assets consists of inventory or receivables with uncertain collectability, the effective liquidity could be lower than the ratios suggest. Similarly, the nature of current liabilities—whether they are primarily short-term debt, accounts payable, or accrued expenses—affects the company's near-term cash flow demands. Understanding the timing and flexibility of these obligations is crucial to evaluating the company's ability to sustain operations without additional financing or asset sales.
Revenue Scale vs. Operating Loss: What the Numbers Suggest
With $905 million in quarterly revenue, Vylor operates at a scale consistent with a major public company, but the $475 million quarterly net loss underscores significant cost or margin pressures. The lack of business model detail precludes definitive statements about revenue composition—whether it arises from products, services, or licensing, and whether margins are structurally thin or temporarily depressed by transition costs. If the company inherited fixed cost structures or legacy obligations from Corteva, operating leverage may be muted in the near term, and any substantial variable costs could further pressure margins. If Vylor’s losses are due to one-time separation costs or investments in growth, future margin normalization is plausible; however, if losses are operational, a turnaround would require a fundamental shift in pricing, volume, or cost structure. [S1]
The structural drivers behind Vylor's revenue and cost base remain critical unknowns that would materially influence future profitability. If the company's revenue depends heavily on long-term contracts or recurring service agreements, this could provide a more stable foundation for margin expansion compared to a transactional sales model. Conversely, if revenue is concentrated in a few large customers or volatile markets, earnings predictability may be limited. On the cost side, distinguishing between fixed and variable expenses is essential; a high fixed cost base inherited from the parent company could create operating leverage but also heighten risk during revenue fluctuations. Additionally, the company's investment in research and development, marketing, or technology platforms—if disclosed—would help clarify whether current losses reflect strategic growth initiatives or structural inefficiencies.
Market Standing Without a Moat: The Implications of Limited Disclosure
Vylor’s rapid entry into the S&P 500 and analyst initiation signal market recognition, but the absence of disclosed business segments or industry focus makes it difficult to ascertain the company’s true competitive positioning. If Vylor operates in a sector similar to Corteva—such as agriculture, chemicals, or biotech—it could face entrenched competitors with established brands, distribution, and R&D capabilities. Without clear information on proprietary technology, customer relationships, or barriers to entry, it is impossible to confirm the existence of a durable moat. The risk factors cited in the SEC context—ranging from regulatory compliance and climate impact to competition and IP challenges—suggest exposure to complex, high-stakes industries. Future disclosures clarifying Vylor’s business model, market share, and sources of differentiation would be required to evaluate whether the company can defend or expand its position against sector incumbents and potential disruptors. [S1]
The absence of clear business segment information complicates not only competitive analysis but also the assessment of regulatory and market risks inherent to Vylor’s operations. Different industries carry distinct risk profiles related to compliance, intellectual property, and environmental impact, all of which can materially affect cost structures and barriers to entry. For example, a company operating in highly regulated sectors may face prolonged approval timelines and higher compliance costs, which can depress margins and limit agility. Alternatively, if Vylor’s business model involves proprietary technology or specialized knowledge, this could create defensible competitive advantages even in crowded markets. Without transparency on these dimensions, investors must weigh the potential for both heightened risk exposure and untapped strategic assets, making valuation and risk management challenging.
Unlocking Value Through Clarity and Margin Expansion
The most favorable path for Vylor would involve converting its substantial revenue base into sustainable profits, aided by increased transparency around its business model and strategic priorities. If management discloses operational details that reveal high-margin products, scalable platforms, or unique market access, investor confidence could rise, reducing volatility and supporting a higher valuation. Margin improvement could result from post-spin-off cost rationalization, divestment of underperforming assets, or successful commercialization of proprietary offerings. Evidence confirming this scenario would include forward guidance showing narrowing losses, disclosure of high-value customer contracts or technology assets, and a shift in analyst ratings toward strong buy. Conversely, persistent lack of disclosure, continued large operating losses, or negative analyst revisions would falsify the upside thesis. [S1] [N6] [N8]
Opaque Operations Sustain Uncertainty Despite Market Presence
The most plausible near-term outcome is that Vylor remains a large, actively traded company with reported liquidity position but ongoing uncertainty around its operating model and path to profitability. The company may continue to generate significant revenue but also report net losses, as legacy cost structures and integration challenges from the spin-off persist. ETF flows and analyst coverage will likely reflect this ambiguity, with share price volatility driven more by sentiment and macro factors than by fundamental results. Confirmation of this scenario would come from continued limited disclosure, erratic earnings performance, and mixed or neutral analyst ratings. Evidence that would falsify the base case includes a marked shift toward transparency, consistent profitability, or the emergence of clear business drivers. [S1] [N2] [N3] [N6] [N8]
Profitability Challenges Deepen Amid Ongoing Opacity
If Vylor’s losses are structural—stemming from uncompetitive products, high fixed costs, or adverse market dynamics—and the company fails to provide greater operational visibility, investor confidence could erode further. This scenario could see accelerating ETF outflows, negative analyst revisions, and potential pressure on liquidity if losses persist or worsen. In the extreme, the company could face pressure to restructure, divest assets, or seek external funding on unfavorable terms. Confirming evidence would include widening losses, deteriorating liquidity metrics, and negative changes to index inclusion or analyst ratings. A reversal of these trends—such as improved margins or meaningful disclosure—would challenge the downside thesis. [S1] [N3] [N6]
Milestones and Disclosures That Could Reshape Vylor’s Investment Case
Disclosure of business segment or industry breakdown—would clarify revenue sources and competitive context.
Trends in quarterly operating margin and net income—a narrowing loss or move to profitability would signal improving economics.
Updates on cost structure or post-spin-off integration—if disclosed, would help assess fixed vs. variable cost dynamics.
Material analyst rating changes or price targets—would reflect shifting market confidence as new information emerges.
ETF flow patterns—sustained inflows or outflows could indicate changing institutional sentiment.
Capital allocation or restructuring announcements—such as asset sales, acquisitions, or cost-cutting initiatives.
Changes to index inclusion status—would signal broader market perception and could impact share demand.
Liquidity and working capital trends—ongoing tracking of current and cash ratios, if disclosed, to gauge potential financial flexibility.
Disclaimer: This is research-only, informational analysis and not investment advice. It may include AI-generated interpretation and general industry context. Always verify important details using primary sources.

Comments