
Washington Trust Bancorp: Rebounding from Credit Challenges with Strategic Incentives
Washington Trust Bancorp navigated substantial 2025 commercial loan charge-offs by leveraging bolstered liquidity and a new executive incentive plan to enhance disciplined growth and asset quality.
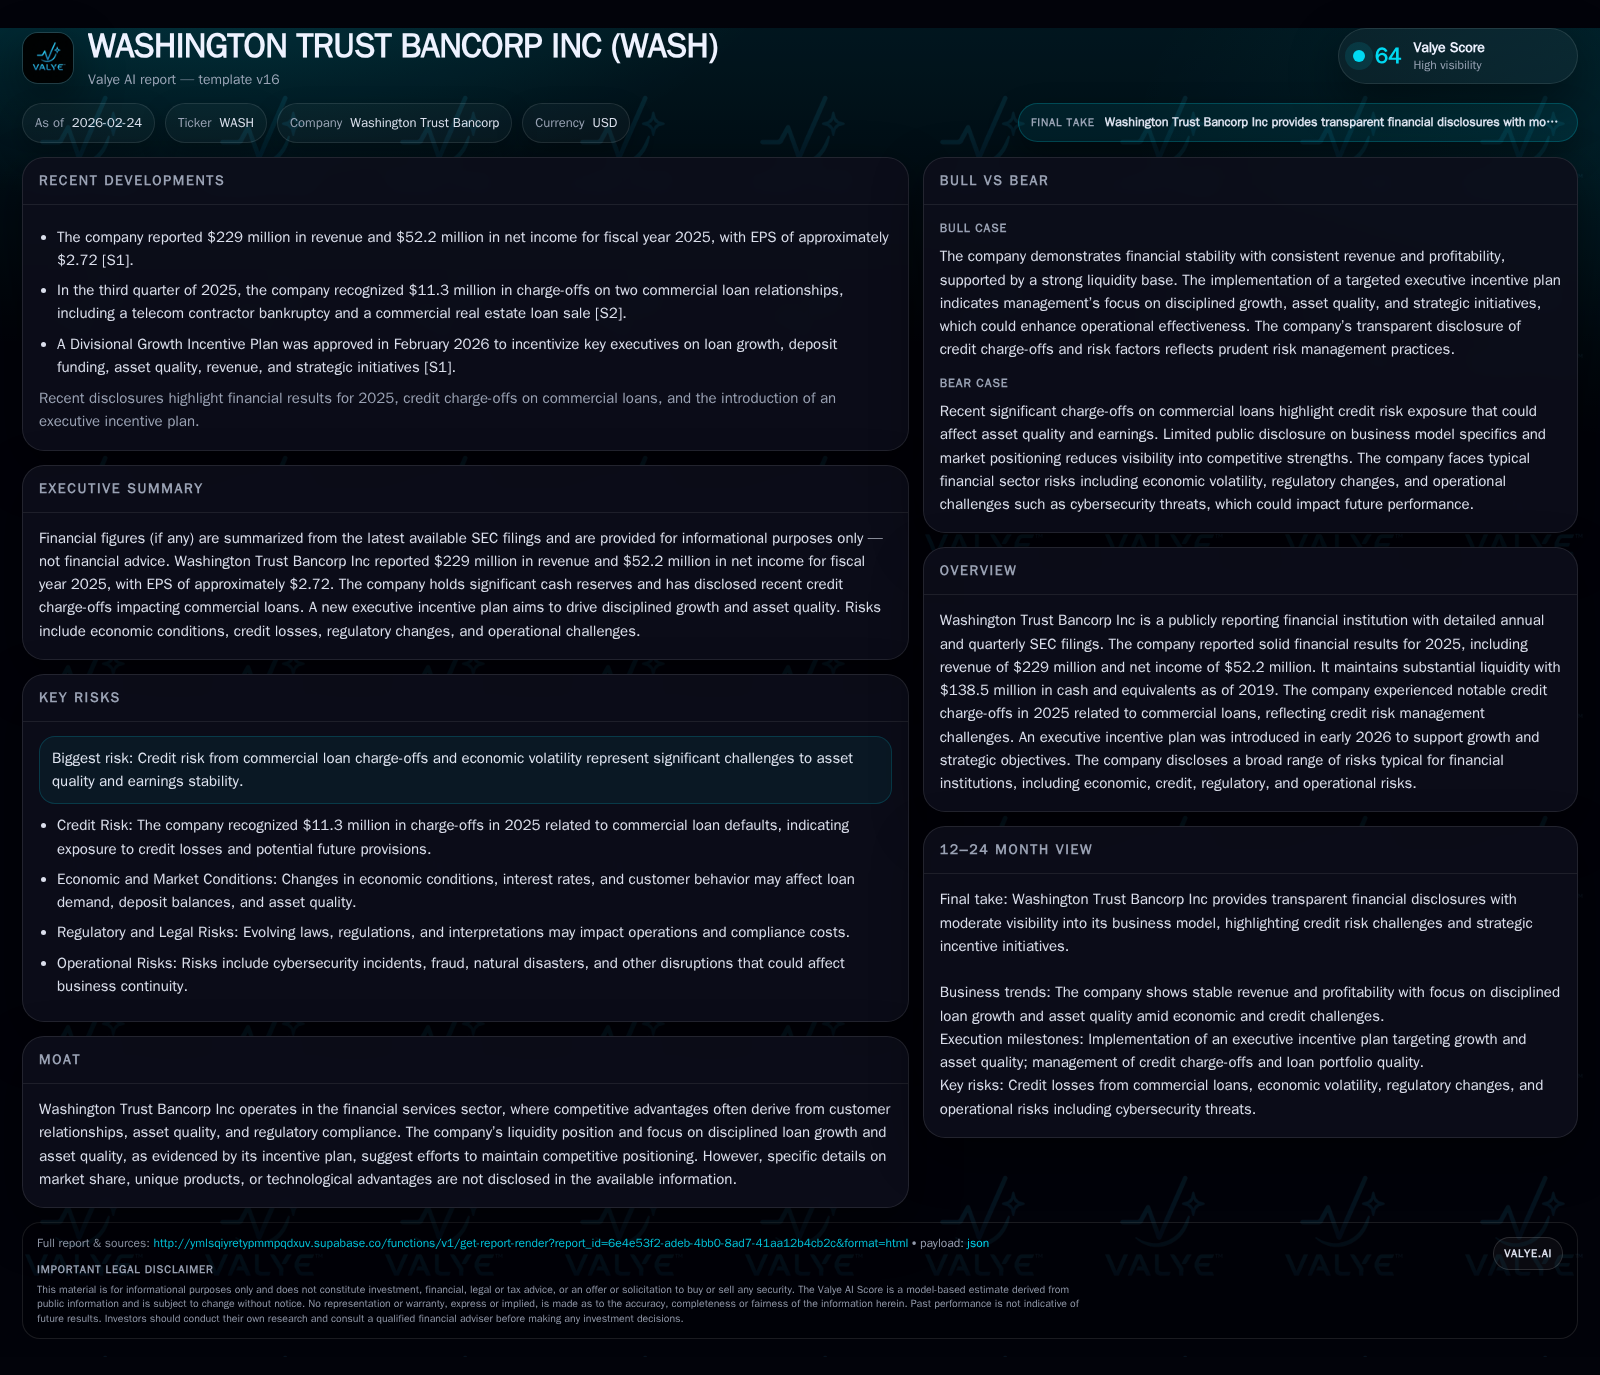
Washington Trust Bancorp posted a significant financial recovery in 2025 following considerable credit losses from commercial loans. The firm’s revenue surged 127.6% year-over-year to $229 million, with net income rebounding 286.2% to $52.2 million, driven by strong operational cash flow and improved credit management actions. In response to elevated charge-offs impacting asset quality, management implemented a Divisional Growth Incentive Plan in early 2026, targeting key banking officers to align growth initiatives with risk discipline. The bank maintains robust liquidity reserves and has resumed active share repurchases in addition to stable dividend payments, underpinning its capital return strategy amid ongoing economic and credit risks.
Financial Turnaround: Revenue and Profit Trajectory Through Recent Years
Washington Trust Bancorp's financial performance over the four years ending in fiscal 2025 reveals a pronounced volatility primarily due to credit losses and subsequent recoveries. After generating revenues of $218.6 million in 2022, the bank experienced a decline to $193.2 million in 2023 before plunging drastically to $100.7 million in 2024—a year marked by heavy credit provisioning culminating in a net loss of $28.1 million that year [F1].
However, fiscal 2025 witnessed a remarkable resurgence as revenues more than doubled (+127.6% YoY) to $229 million, propelled by both improved loan originations and recovering fee income streams [F1]. This revenue rebound contributed materially to the net income turnaround: from a significant loss in 2024 to a positive net income of $52.2 million (+286.2% YoY). Operating cash flow also followed an upward trajectory reaching $80.3 million (+39.3%), indicating robust core earnings generation despite prior volatility [F1].
Capital expenditures were sharply reduced by approximately half compared to the prior year ($2.0 million vs. $4.0 million), reflecting disciplined investment spending during this recovery phase [F1]. Following subdued equity growth through earlier years, shareholders’ equity expanded moderately to $543.6 million as of December 31, 2025.
Historical performance (annual)
| FY | Rev ($mm) | Net ($mm) | CFO ($mm) | Capex ($mm) | Rev YoY | Net YoY |
|---|---|---|---|---|---|---|
| 2025 | 229 | 52 | 80 | 2 | +127.6% | +286.2% |
| 2024 | 101 | -28 | 58 | 4 | -47.9% | -158.2% |
| 2023 | 193 | 48 | 32 | 5 | -11.6% | -32.8% |
| 2022 | 219 | 72 | 113 | 6 |
Note: Omitted columns lack sufficient annual XBRL coverage in the provided tags (need ≥2 annual points): OpInc. Source: SEC companyfacts cache [F1].
Capital returns and efficiency (annual)
| FY | Div ($mm) | Buybacks ($mm) | FCF ($mm) |
|---|---|---|---|
| 2025 | 43 | 7 | 78 |
| 2024 | 38 | 0 | 54 |
| 2023 | 39 | 9 | 27 |
| 2022 | 38 | 9 | 107 |
Source: SEC companyfacts cache [F1].
Note: ROE is approximated as net income divided by year-end equity; Equity figures available separately [F1].
The marked rebounding results underscore operational resilience despite pockets of elevated credit risk that affected earnings stability.
Credit Risk Events and Their Impact on Asset Quality in 2025
A pivotal factor constraining Washington Trust’s earnings stream through mid-2025 was its exposure to two high-profile troubled commercial loans that triggered material charge-offs [S13]. First was participation in a shared national credit facility extended to a telecom infrastructure construction contractor which filed for Chapter 11 bankruptcy during Q2 2025 [S13]. The company placed this loan on nonaccrual status early due to deteriorating credit quality; its carrying value stood at around $9.3 million as of June 30 with specific reserves of $2.3 million already recognized [S13]. Following court proceedings developments in Q3, the bank absorbed an $8.3 million charge-off while retaining an estimated collectible residual of approximately $1 million expected later in the year [S13].
The second charged-off asset was a nonaccrual commercial real estate loan secured by a Class B office property valued at roughly $4.3 million at mid-year [S13]. Washington Trust elected to sell this loan late in Q3 2025 recognizing a charge-off of about $3 million upon sale completion [S13].
These sizeable charge-offs collectively impaired earnings but effectively cleansed the portfolio's high-risk exposures, lowering subsequent nonaccrual commercial loans from approximately $14 million mid-year down to around $1 million by quarter end [S13]. This decisive action established clearer visibility into asset quality trends going forward.
The elevated provision for credit losses—$7 million recognized primarily during Q3—reflected prudential conservatism amidst uncertain economic conditions affecting commercial borrowers regionally [S13][S7][S8][S5]. These events highlight sector-native challenges inherent in middle-market lending segments where bankruptcy-induced default clustering can impose episodic stresses.
Executive Incentive Plan as a Catalyst for Renewed Growth Focus
In response to these credit headwinds and aiming to strategically realign growth objectives while preserving asset quality, Washington Trust’s Compensation & Human Resources Committee launched the Divisional Growth Incentive Plan in February 2026 [S3][S25].
This targeted plan exclusively covers four senior executives:
- Chief Commercial Banking Officer
- Chief Retail Banking Officer
- Chief Wealth Management Officer
- Chief Retail Lending Officer
Structured payouts under this scheme range between zero and one-and-a-half times target incentives based on achievement across multidimensional metrics including:
- Disciplined loan origination growth,
- Strengthening core deposit funding,
- Maintaining strict asset quality standards,
- Increasing total revenue production,
- Advancing select strategic initiatives aligned with corporate priorities.
By diagnosing key drivers behind recent financial setbacks, this sector-specific incentive aligns managerial behavior closely with calibrated risk-taking principles rather than unbridled volume expansion—an approach common across regional banks exposed to cyclical credit downturns [S25]. The Committee retains flexibility over metric weighting and award scales providing adaptability as market conditions evolve.
Liquidity and Capital Structure: Strength Amidst Market Volatility
Liquidity buffers have historically played an important role for Washington Trust, with cash and equivalents reported at nearly $138.5 million as of end-2019—serving as a foundational reserve during volatile periods [F1]. Though recent filings do not update this figure explicitly, continuous disclosures indicate ongoing maintenance of substantial liquid assets commensurate with lending activity levels [S9][S10][S12][S21].
Debt structure adjustments through late-2025 suggest prudent refinancing efforts managing maturities and interest rate exposures amid rising rate environments typical for regional banks [S9][S14][S16][S19][S20][S22][S23][S24]. Market risk disclosures emphasize hedging practices designed to smooth earnings volatility stemming from balance sheet repricing mismatches.
This conservative liquidity profile supports both operational needs and potential capital returns via dividends or share repurchases without jeopardizing regulatory capital ratios or risk-based leverage thresholds.
Capital Returns: Dividends, Share Repurchases, and Return on Equity
Washington Trust has maintained consistent dividend payouts for shareholders even through turbulent periods—disbursing approximately $43 million in dividends during FY 2025 representing modest increases over prior years (circa $38–$39 million range during FY 2022–24) [F1][S11][S25]. This steady policy signals confidence in sustainable cash flow generation capabilities.
Share repurchase activity halted entirely through most of FY 2024 but resumed mid-2025 with buybacks aggregating approximately $7.36 million by year-end [F1][S11][S25], evidencing opportunistic engagement given favorable market pricing or capital positions.
Calculated return on equity for fiscal-year-end December 31, 2025 approximates near-term profitability at roughly 9.6%, derived from reported net income versus shareholders’ equity balances—moderate yet reflective of healing asset performance and operational efficiency improvements post-charge-offs [F1]. Positive free cash flow adjusted for capital spending (~$78M) further underpins capacity for reinvestment or shareholder distributions.
Together these elements portray a balanced capital allocation strategy geared toward reinforcing franchise vitality while rewarding investors responsibly amidst cyclic pressures.
Outlook: Key Factors to Watch for Washington Trust’s Growth and Risk Management
Looking ahead, several critical factors will influence Washington Trust Bancorp’s trajectory:
- Interest rate fluctuations remain paramount drivers shaping net interest margins given the traditional mismatch between fixed-rate loans and potentially variable deposits or wholesale funding costs .
- Credit risk evolution post the substantial Q3 2025 charge-offs warrants close monitoring; resurgence or emergence of loan delinquencies particularly within impacted sectors could constrain margin expansion opportunities [N1][S2][S5].
- Regulatory compliance complexity is intensifying regionally amid evolving prudential standards relating to capital adequacy, liquidity coverage ratio implementation, anti-money laundering scrutiny, cybersecurity mandates, all imposing incremental expense burdens or operational risk exposures.
- Loan demand may reflect broader macroeconomic momentum; sluggish commercial property markets or shrinking business investment could limit origination volumes while competitive deposit pricing pressure might challenge core funding stability.
- Implementation efficacy of the newly established executive incentive plan will be instrumental; its design embraces senior bank officers directly accountable for commercial/retail banking outcomes balancing growth versus risk considerations—a tactical alignment intended to mitigate recurrence of previous asset quality impairments.
Stakeholders should track quarterly disclosures focusing on:
- Non-accrual loan movements,
- Provision expense trends,
- Deposit composition shifts,
- Execution against incentive plan targets,
- Capital return cadence adjustments within regulatory constraints.
Such indicators will provide early insights into whether Washington Trust can build upon its recovery momentum while containing inherent sector risks across interest-sensitive balance sheet components.
Disclaimer: This analysis is based solely on publicly available information up through February 24, 2026 including SEC filings and company disclosures; no investment advice is offered herein.
Disclaimer: This is research-only, informational analysis and not investment advice. It may include AI-generated interpretation and general industry context. Always verify important details using primary sources.
Comments