
Winmark Corp’s Franchise Model Drives Steady Earnings and Robust Dividend Returns
Winmark’s franchise system underpins consistent revenue growth, operational profitability, disciplined capital allocation, and proactive cybersecurity risk governance.
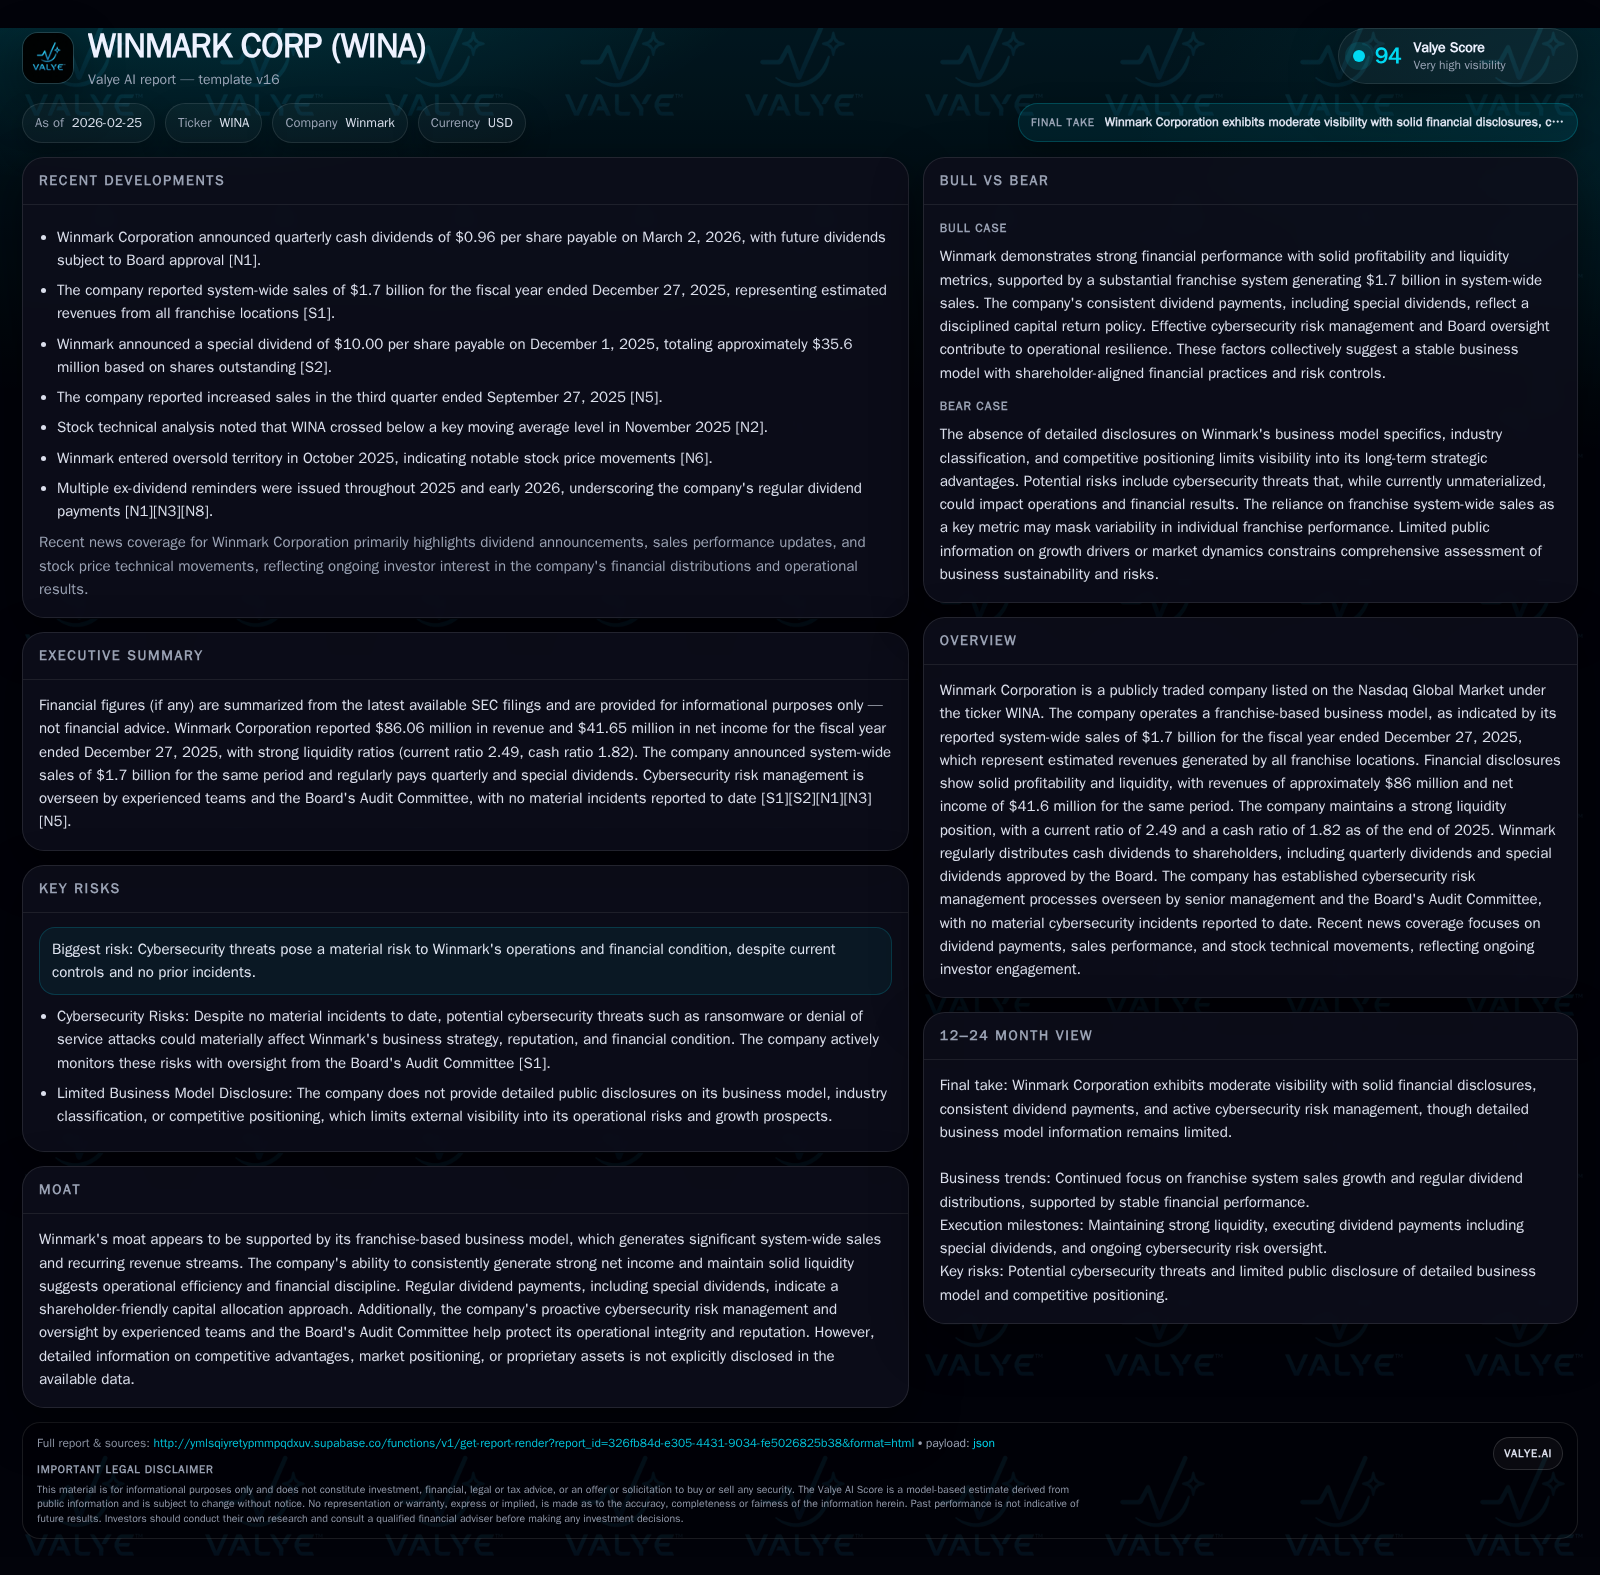
Winmark Corporation operates a franchise-based business model generating $1.7 billion in system-wide sales for fiscal 2025. The company has demonstrated steady revenue and profit growth with revenues hitting $86.1 million and net income reaching $41.7 million in 2025. Winmark maintains a strong liquidity position, supports regular and special dividend payments, and manages cybersecurity risks through comprehensive governance frameworks. Future growth depends on franchise expansion balanced with market saturation risks and evolving digital security threats.
Franchise-Driven Revenue Growth: Historical Trends and Momentum
Winmark Corporation’s revenue trajectory over the past four fiscal years illustrates a pattern of steady growth anchored in its franchise business model. Revenues increased from approximately $81.4 million in FY2022 to $86.1 million in FY2025, representing a compound annual growth rate just under 2%. The year-over-year revenue change was particularly notable at +5.9% in FY2025 compared to FY2024 [F1]. Despite some minor fluctuations—such as a dip observed in FY2024 relative to FY2023—the overall momentum reflects sustained franchise unit activity and healthy brand penetration among a growing reseller network.
This revenue stream reflects company revenues derived primarily from fees and royalties tied to the performance of its franchised resale stores rather than direct merchandise sales. Thus, while Winmark's reported revenues are modest compared with total system-wide sales figures, they offer a reliable proxy of company-controlled economic participation within the broader franchise ecosystem.
Profitability Dynamics and Operating Efficiency Over Time
Operating income during the same period has remained impressively consistent despite modest revenue changes, hovering between $53 million and $55 million annually. This yielded stable operating margin levels around the mid-60% range (approximately 63-64%), underscoring efficient cost management inherent to Winmark’s low-capital-intensity model and franchising leverage [F1].
Net income marginally expanded from $39.4 million in FY2022 to $41.7 million in FY2025—an increase of about 6% over four years—with a +4.3% year-on-year uplift recorded in the last fiscal year alone. This steadiness suggests Winmark effectively balances fixed overheads against fee-based revenue streams gained from expanding or sustaining its franchise network while managing operating expenses tightly.
Operating cash flows also reinforced this picture of financial health with a rise from roughly $43.8 million in FY2022 to nearly $45 million by FY2025, representing solid cash generation capacity that comfortably exceeds minimal capital expenditures (capex remained under $0.2 million annually). The resulting free cash flow supports robust dividends and opportunistic buybacks without reliance on external financing [F1].
System-Wide Sales as a Growth Indicator: What the Numbers Say
A particularly salient metric for evaluating Winmark’s operational scale is its declared system-wide sales figure—defined as estimated aggregate revenue generated by all franchised locations during the fiscal year—which stood at approximately $1.7 billion for fiscal year ended December 27, 2025 [N13]. This statistic far surpasses the company’s own reported revenues as it encompasses the economic activity across thousands of independent reselling outlets operating under Winmark’s established brand names.
System-wide sales serve as an indirect but vital gauge of the overall health, expansion, and vitality of Winmark's franchise ecosystem, indicating steady or growing consumer demand for resale merchandise within its branded network segments.
Exploring Future Growth Opportunities and Structural Constraints
Looking ahead, Winmark’s primary driver of expansion remains the development of new franchise locations coupled with sustained sales performance at existing outlets [S1][S2]. However, structural constraints such as possible market saturation—given niche positioning within resale—and macroeconomic headwinds affecting discretionary consumer expenditures could cap growth rates.
The filings provide limited quantitative forward guidance but emphasize vigilance around competitive pressures inherent to retail resale franchises alongside broader uncertainties related to consumer behavior shifts or supply chain disruptions impacting inventory acquisition at franchisee levels [S2].
Capital Allocation Track Record: Dividends, Buybacks, and Cash Flow Generation
Winmark demonstrates disciplined capital allocation focused on returning cash to shareholders complemented by prudent reinvestment policies. Quarterly dividends have been consistently paid at $0.96 per share throughout recent periods with Board-approved special dividends—a notable example being a substantial $10 per share payout totaling approximately $35.6 million paid in December 2025—emblematic of excess liquidity distribution and shareholder alignment [S9][S10][S13].
Buyback activities tell an evolving story; while significant repurchases were recorded totaling nearly $49 million in prior years (FY2023-FY2024), repurchase amounts fell markedly to roughly $2.4 million in FY2025 indicating a strategic pivot towards dividends over stock retirements recently [F1].
Overall balance sheet liquidity is robust with current ratio at 2.49 and cash ratio at approximately 1.82 underscoring ample short-term asset coverage over liabilities, supporting ongoing dividend sustainability even amidst limited capex needs below $200,000 annually [F1]. These factors reflect sound financial stewardship fostering shareholder value through stable earnings retention complemented by generous cash returns.
Managing Cybersecurity Risks Amid Digital Operational Demands
In recognition of heightened digital threats impacting modern franchising operations reliant on integrated information systems, Winmark has established comprehensive cybersecurity governance frameworks tightly overseen by senior management teams including the CFO and Vice President of Technology supported by external consulting specialists averaging two decades’ expertise [S1][S8].
The Board’s Audit Committee takes explicit responsibility for reviewing risk assessments covering ransomware attempts, denial-of-service vectors, potential exploitation of vulnerabilities within systems integral to franchise communications and royalty processing infrastructure [S8]. While no prior incidents materially influenced operations or financial outcomes to date, proactive measures focus on prevention, detection strategies alongside rapid containment protocols—crucial for safeguarding brand reputation across decentralized owner-operator networks reliant on digital connectivity.
Outlook: Milestones to Monitor and Key Performance Drivers Ahead
Key performance indicators warranting close observation include system-wide sales growth velocity serving as an early barometer for franchise network health beyond reported direct revenues [N13]. Monitoring future declarations around dividend policies—especially potential additional special dividends—will signal underlying free cash flow robustness plus Board confidence in sustained profit streams [S9].
Additionally, disclosures related to technological advancements or revisions within cybersecurity governance structures will provide insight into Winmark’s adaptive resilience toward emerging digital risks inherent in franchise-based business models reliant on secure IT ecosystems [S1]. Given absence of explicit formal forecasts or external analyst projections in filings currently available, these factors collectively comprise reasoned watchpoints informing an understanding of future operational durability.
Summary Table: Financial Performance Snapshot (FY2022-FY2025)
Historical performance (annual)
| FY | Rev ($mm) | Net ($mm) | CFO ($mm) | OpInc ($mm) | Rev YoY | Net YoY |
|---|---|---|---|---|---|---|
| 2025 | 86 | 42 | 45 | 55 | +5.9% | +4.3% |
| 2024 | 81 | 40 | 42 | 53 | -2.3% | -0.6% |
| 2023 | 83 | 40 | 44 | 53 | +2.3% | +1.9% |
| 2022 | 81 | 39 | 44 | 54 |
Note: Omitted columns lack sufficient annual XBRL coverage in the provided tags (need ≥2 annual points): Capex. Source: SEC companyfacts cache [F1].
Capital returns and efficiency (annual)
| FY | Div ($mm) | Buybacks ($mm) | FCF ($mm) |
|---|---|---|---|
| 2025 | 49 | 2 | 45 |
| 2024 | 39 | 49 | 42 |
| 2023 | 44 | 49 | 44 |
| 2022 | 19 | 49 | 44 |
Source: SEC companyfacts cache [F1]. Note: ROE not included due to negative stockholders’ equity primarily from treasury share accounting; Buybacks omitted due to inconsistent reporting timestamps.
This analysis synthesizes publicly available SEC filings and associated announcements for Winmark Corporation through early calendar year-end reporting periods up to February 25, 2026 ([F1],[S#],[N#]). It endeavors to provide an internally coherent view rooted strictly in disclosed data without speculative extrapolation.
Disclaimer: This document is prepared solely for informational purposes from supplied factual sources; it does not constitute investment advice nor an endorsement or recommendation regarding any security referenced herein.
Disclaimer: This is research-only, informational analysis and not investment advice. It may include AI-generated interpretation and general industry context. Always verify important details using primary sources.
Comments