
Zions Bancorporation Builds on Regional Strengths Amid Credit and Tech Risks
Zions leverages its affiliate bank model and technology upgrades to sustain growth while managing evolving credit and operational challenges.
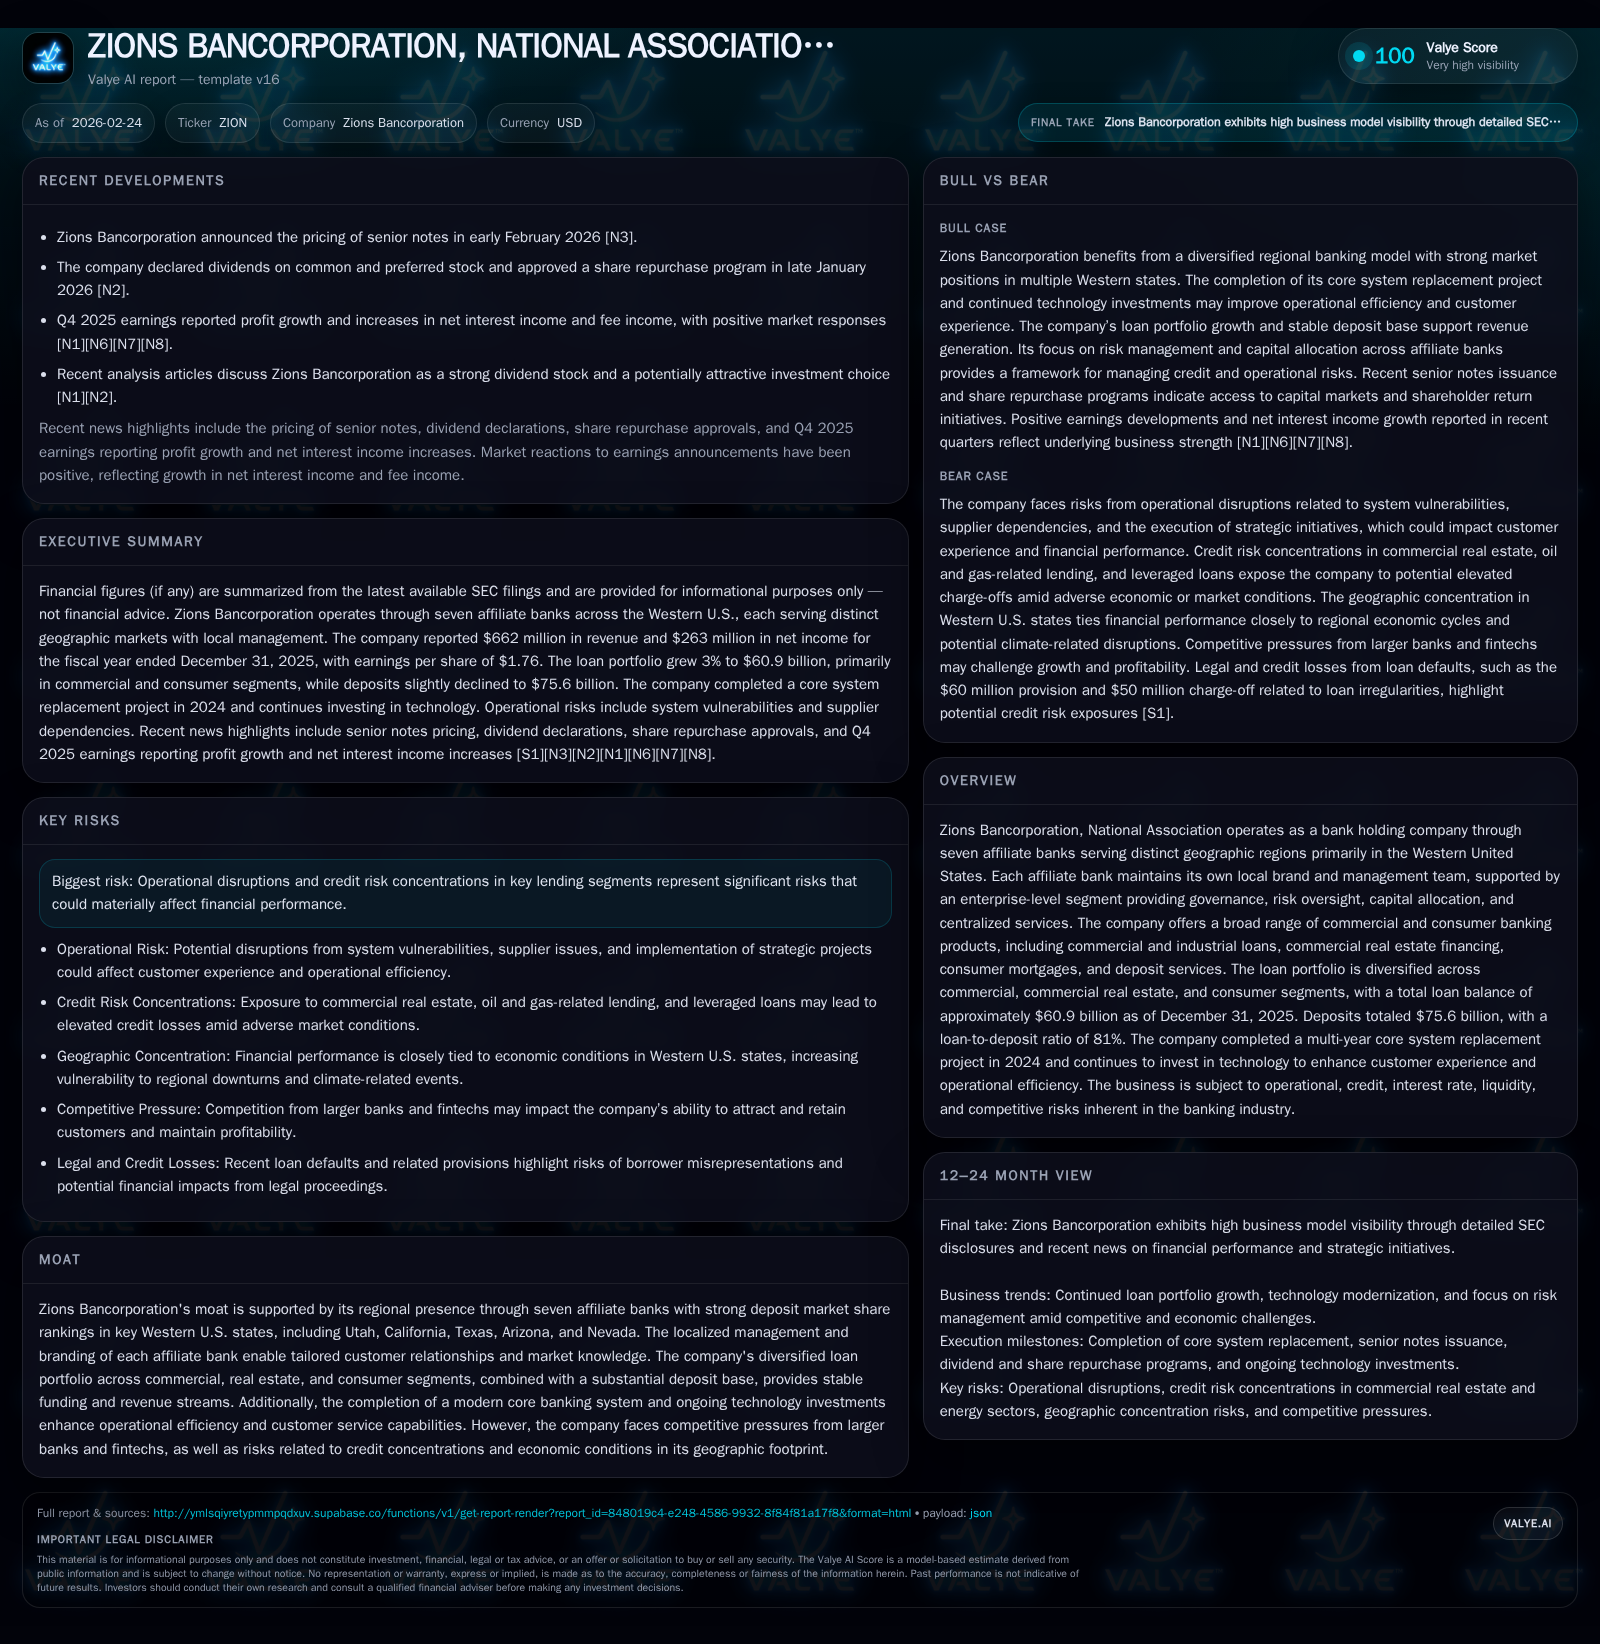
Zions Bancorporation operates through seven regional affiliate banks primarily in the Western U.S., enabling tailored local market penetration and customer relationships supported by centralized governance. In 2025, Zions reported modest revenue growth driven by net interest income expansion despite elevated credit loss provisions reflecting headwinds in commercial real estate and concentrated sectors. The bank completed a long-term core system replacement project enhancing operational efficiency, though ongoing credit quality risks and technological execution remain focal points. Capital allocation in dividends and share buybacks reflects disciplined management amid rising regulatory demands and economic uncertainties.
Affiliate Bank Model Fuels Diverse Regional Market Penetration
Zions Bancorporation’s organizational architecture is anchored by seven independently operated affiliate banks: Zions Bank, California Bank & Trust (CB&T), Amegy Bank of Texas (Amegy), National Bank of Arizona (NBAZ), Nevada State Bank (NSB), Vectra Bank Colorado (Vectra), and Texas Capital Bank (TCBW). Each affiliate maintains distinct branding and local management teams tailored to their respective western U.S. markets spanning Utah, California, Texas, Arizona, Nevada, Idaho, Wyoming, and Colorado [S1][S6]. This decentralized approach enables nuanced customer engagement benefiting from deep regional market knowledge while relying on a parent-level "Other" segment that centralizes governance functions including enterprise risk oversight, capital allocation aligned with risk-weighted assets across affiliates, strategic objective setting, centralized technology infrastructure investment, and back-office operations [S1][S6].
The deposit footprint illustrates this moat: for example, Zions Bank itself ranks as the second-largest full-service commercial bank in Utah and fifth-largest in Idaho as of mid-2025 [S6]. This positioning reflects durable deposit market share driven by localized product strategy combined with scale advantages from integrated services support at the parent level. Branch networks are extensive — e.g., Zions Bank operated over 90 branches within Utah alone at year-end.
The affiliate model mitigates certain competitive pressures inherent to larger monolithic bank structures by fostering agility yet delivering cost synergies through shared services. Risk-weighted capital allocation leverages robust internal funds transfer pricing methodologies measuring segment profitability on a risk-adjusted basis [S1]. This structural differentiation remains a core competitive advantage during an industry landscape increasingly shaped by consolidation trends [S25].
Historical Revenue and Earnings Growth with Segment Insights
From FY2022 through FY2025, Zions showed consistent topline growth with revenues advancing from $614 million in 2022 to $662 million in 2025 — representing an overall CAGR near 2.4%, including a +3.6% increase between 2024 and 2025 [F1]. Net income demonstrated more pronounced improvement following a trough in 2023 ($126 million), rebounding sharply to $263 million in 2025 — a +21.8% uplift YoY [F1]. This progression reflects operational leverage amid improving net interest income performance despite episodic credit challenges.
Operating cash flows fluctuated more noticeably; after peaking at $1.47 billion in 2022 they declined somewhat to $1.07 billion by end-2025 (-6.5% YoY) despite rising revenues [F1]. Increased capital expenditure on technology platforms primarily accounts for part of the cash flow moderation [F1].
Capital returns via dividends remained steady around the high-$260 million mark annually; however share buybacks saw marked moderation — falling from $202 million repurchased in 2022 to merely $41 million in 2025 [F1]. These shifts underscore prudent capital management responding to evolving risk conditions while sustaining shareholder distributions.
Historical performance (annual)
| FY | Rev ($mm) | Net ($mm) | CFO ($mm) | Capex ($mm) | Rev YoY | Net YoY |
|---|---|---|---|---|---|---|
| 2025 | 662 | 263 | 1073 | 121 | +3.6% | +21.8% |
| 2024 | 639 | 216 | 1148 | 97 | +3.1% | +71.4% |
| 2023 | 620 | 126 | 885 | 113 | +1.0% | -55.6% |
| 2022 | 614 | 284 | 1470 | 190 |
Note: Omitted columns lack sufficient annual XBRL coverage in the provided tags (need ≥2 annual points): OpInc. Source: SEC companyfacts cache [F1].
Capital returns and efficiency (annual)
| FY | Div ($mm) | Buybacks ($mm) | FCF ($mm) |
|---|---|---|---|
| 2025 | 267 | 41 | 952 |
| 2024 | 289 | 36 | 1051 |
| 2023 | 282 | 51 | 772 |
| 2022 | 269 | 202 | 1280 |
Source: SEC companyfacts cache [F1].
Note: Operating income not available from provided tags; table omits related metrics accordingly.
Loan Portfolio Composition and Emerging Credit Challenges
The loan portfolio increased moderately by $1.5 billion to about $60.9 billion at year-end December 31, 2025 — reflecting a diversified blend with commercial loans accounting for roughly half the portfolio (52%), commercial real estate about one-fifth (22%), and consumer loans close behind at roughly one-quarter (26%) [S5][F1]. Within commercial loans, commercial & industrial exposure stands at approximately $17.8 billion or ~29% of total loans.
Commercial real estate lending is split primarily between term loans ($11.2 billion) and construction/land development ($2.16 billion), albeit the latter saw reductions relative to prior periods [S5]. Consumer lending includes residential mortgages ($10.46 billion), home equity lines (~$3.95 billion), as well as other revolving credit facilities.
Concentrations present notable risk vectors: elevated vacancy rates plague multifamily, industrial, and office CRE assets across Zions’ Western footprint — accompanied by declining valuations, downward rent pressure via concessions, and higher operating expenses linked to inflationary cost dynamics [S9]. Oil & gas-related exposures alongside leveraged loan portfolios add further risk heterogeneity especially given commodity price volatility as well as emerging regulatory/social emphasis on climate impact [S9].
Recent charge-offs related to two commercial borrowers financing mortgage origination illustrate risks inherent when counterparty profiles concentrate credit exposures [S9][S28]. Credit quality deterioration elevates provisions which rose notably year-over-year impacting net earnings variability.
The enterprise risk management framework incorporates specialized committees overseeing granular credit risk metrics along with stress testing regimes calibrated against adverse macroeconomic scenarios aligned with Federal Reserve standards [S1][S10]. Such governance is critical given geographic revenue concentration where Utah, Idaho, Texas, and California collectively represent over three-quarters of lending exposures [S23].
Technology Modernization’s Impact on Efficiency and Client Experience
A hallmark strategic initiative was completing the three-phase core system replacement project finalized mid-2024 that migrated substantially all loan types — commercial, CRE, consumer — plus deposit accounts onto an integrated modern core banking platform [S11]. This upgrade facilitates streamlined client onboarding workflows alongside enhanced transaction processing speed while reducing legacy system fragmentation.
Further investments continue targeting digital channels for commercial lending origination systems plus retail deposit product modernization aimed at heightened customer experience consistency paired with scalability benefits [S11]. Centralized technology infrastructure supporting distributed affiliate operations permits leveraging enterprise data assets enabling better analytics-driven decision making.
These advancements position Zions competitively against fintech entrants introducing alternative platforms offering digital-first experiences yet balancing execution risks such as implementation delays or disruption during migration phases remains vital given previously noted operational risk factors detailed in filings [S25][S26][S29].
Capital Allocation: Balancing Dividends, Buybacks, and Opportunistic Investing
Capital deployment strategies demonstrate disciplined stewardship influenced strongly by regulatory capital adequacy mandates under OCC supervision including risk-based capital ratios monitored continuously through stress testing models informed by Federal Reserve guidelines [S12][S13]. Dividends paid each year have remained relatively steady around $267–$290 million indicative of commitment to returning capital while preserving buffer capacity.
Buyback activity has moderated sharply since its peak in FY2022 reflecting an opportunistic rather than sustained approach — totaling only $41 million repurchased during FY2025 compared with over $200 million three years prior—possibly signaling cautious navigation within the prevailing economic uncertainty environment [F1][N13]. Capital allocation decisions incorporate risk-weighted asset distribution analyses at segment level aided by internal funds transfer pricing adjustments ensuring alignment between returns generated and associated capital consumption levels across affiliates [S6][N13].
Investment spending has pivoted increasingly towards technology capex which grew substantially (+24.7% YoY) reaching $121 million in FY25 compared with shrinking hardware/physical asset focus branded by previous multi-year system replacement expenditures earlier executed [F1][S11]. Such balance points emphasize preserving flexibility while investing in future scalable growth drivers.
Financial Metrics Analysis: ROE, Cash Flow Trends, and Capital Structure
Zions’ approximate return on equity based on latest full-year net income ($263M) against stockholders’ equity (~$7.18B) computes near a modest ~3.7% level reflecting softness due principally to credit loss impacts coupled with heightened provisioning needs amid economic uncertainty spread across its key Western markets [F1]. This ROE figure offers insight into ongoing profitability pressure points despite operational revenue gains.
Operating cash flow generation remained robust just exceeding $1 billion annually but depicted a mild decline (-6.5%) between fiscal years ’24–’25 partly attributable to increased capex for technology investment phases necessitated by strategic initiatives continuation [F1][N4]. Capital structure remains conservatively leveraged reliant on deposits representing primary funding source totaling approximately $75.6 billion at Dec ’25 with loan-to-deposit ratio refined upward slightly to around ~81%, suggestive of effective liquidity management amid shifting macroeconomic interest rate policies impacting deposit stability [S20],[S7],[N11],[N12].
Higher proportion of noninterest-bearing demand deposits (34%) coupled with sizable insured deposits (55%) contributes positively toward liquidity risk mitigation although persistent competition from fintechs changing deposit behaviors entails continuous adaptive risk oversight particularly regarding rapid deposit outflows enabled via digital transfers today emphasizing the importance of strong system integrity post-core upgrade completion [S7].
Regulatory Landscape and Risk Oversight Framework
Zions maintains multi-tiered governance encompassing various board-level committees such as Audit Committee alongside specialized Risk Oversight Committee (ROC), supplemented operationally by Enterprise Risk Management Committee (ERMC)—chaired by the Chief Risk Officer—which collectively manage defined categories across credit risk exposures; liquidity; market fluctuations; cyber-security vulnerabilities; legal/regulatory compliance including evolving AI governance requirements; operational continuity; reputational vulnerabilities; plus capital adequacy including stress testing under adverse economic scenarios consistent with OCC expectations detailed extensively within recent annual reporting cycles [S1],[S4],[S10],[S21],[S26].
Legal proceedings referenced remain active but immaterial relative to total asset base although rising severity nationally concerning settlement levels raises prudential caution flags alongside insurance coverage constraints possibly exposing residual financial impact pathway risks continuing regulatory scrutiny remains elevated particularly around compliance programs involving anti-money laundering standards plus emerging digital asset regulation frameworks nationally implemented reflecting broader financial services industry trends applying here comprehensively too [S4],[S12],[S27].
Model governance practices integrate conservative assumptions reviewed regularly aiming to mitigate inaccuracies influencing allowance for credit losses estimates adhering ultimately to Federal regulatory models complementing robust third-party provider oversight programs mitigating disruptive supplier risks critical given outsourcing dependencies established across technology service lines affecting delivery reliability substantiated through documented business continuity plans plus disaster recovery protocols post recent core transition effort ensuring operational resilience remains paramount today known industry pain points echoed frequently elsewhere too [S10],[S14],[S26].
Forward-looking Market Dynamics and Key Operational Milestones to Monitor
Investor attention may focus closely on evolving Federal Reserve policy moves impacting net interest income volatility counterbalanced against loan portfolio composition shifts toward less rate-sensitive products underscored during early ’26 earnings commentary highlighting moderated loan demand particularly within CRE verticals subject to tightening underwriting amid collateral devaluation concerns explicitly mentioned during Q4 call transcripts queried recently demonstrating transparency around macro sensitivity scenarios important going forward ([N4],[N5]).
Additional watch points include nonperforming asset trends specifically multifamily/office CRE segments showing early signs of stress requiring vigilant provisioning adjustments alongside cost control programs effectiveness post-major technology upgrade investments as baseline operating efficiency improvement metrics emerge through ’26 operating periods measured against prior benchmarks assist gauging realized benefits from adopted digital enhancements ([N11],[N14]).
Strategic initiatives tied to continued enhancement of client-facing digital tools combined with potential expansions or optimizations within smaller affiliate markets also warrant attention regarding potential incremental revenue streams or market share gains amidst competitive consolidation waves ongoing sector-wide pressures remain considerable thus positioning for sustainable profitable trajectory will be critical for franchise value capture.
This report focuses exclusively on factual analysis derived from company disclosures including SEC filings alongside reputable news sources without providing any investment advice or recommendations.
Disclaimer: This is research-only, informational analysis and not investment advice. It may include AI-generated interpretation and general industry context. Always verify important details using primary sources.
Comments