
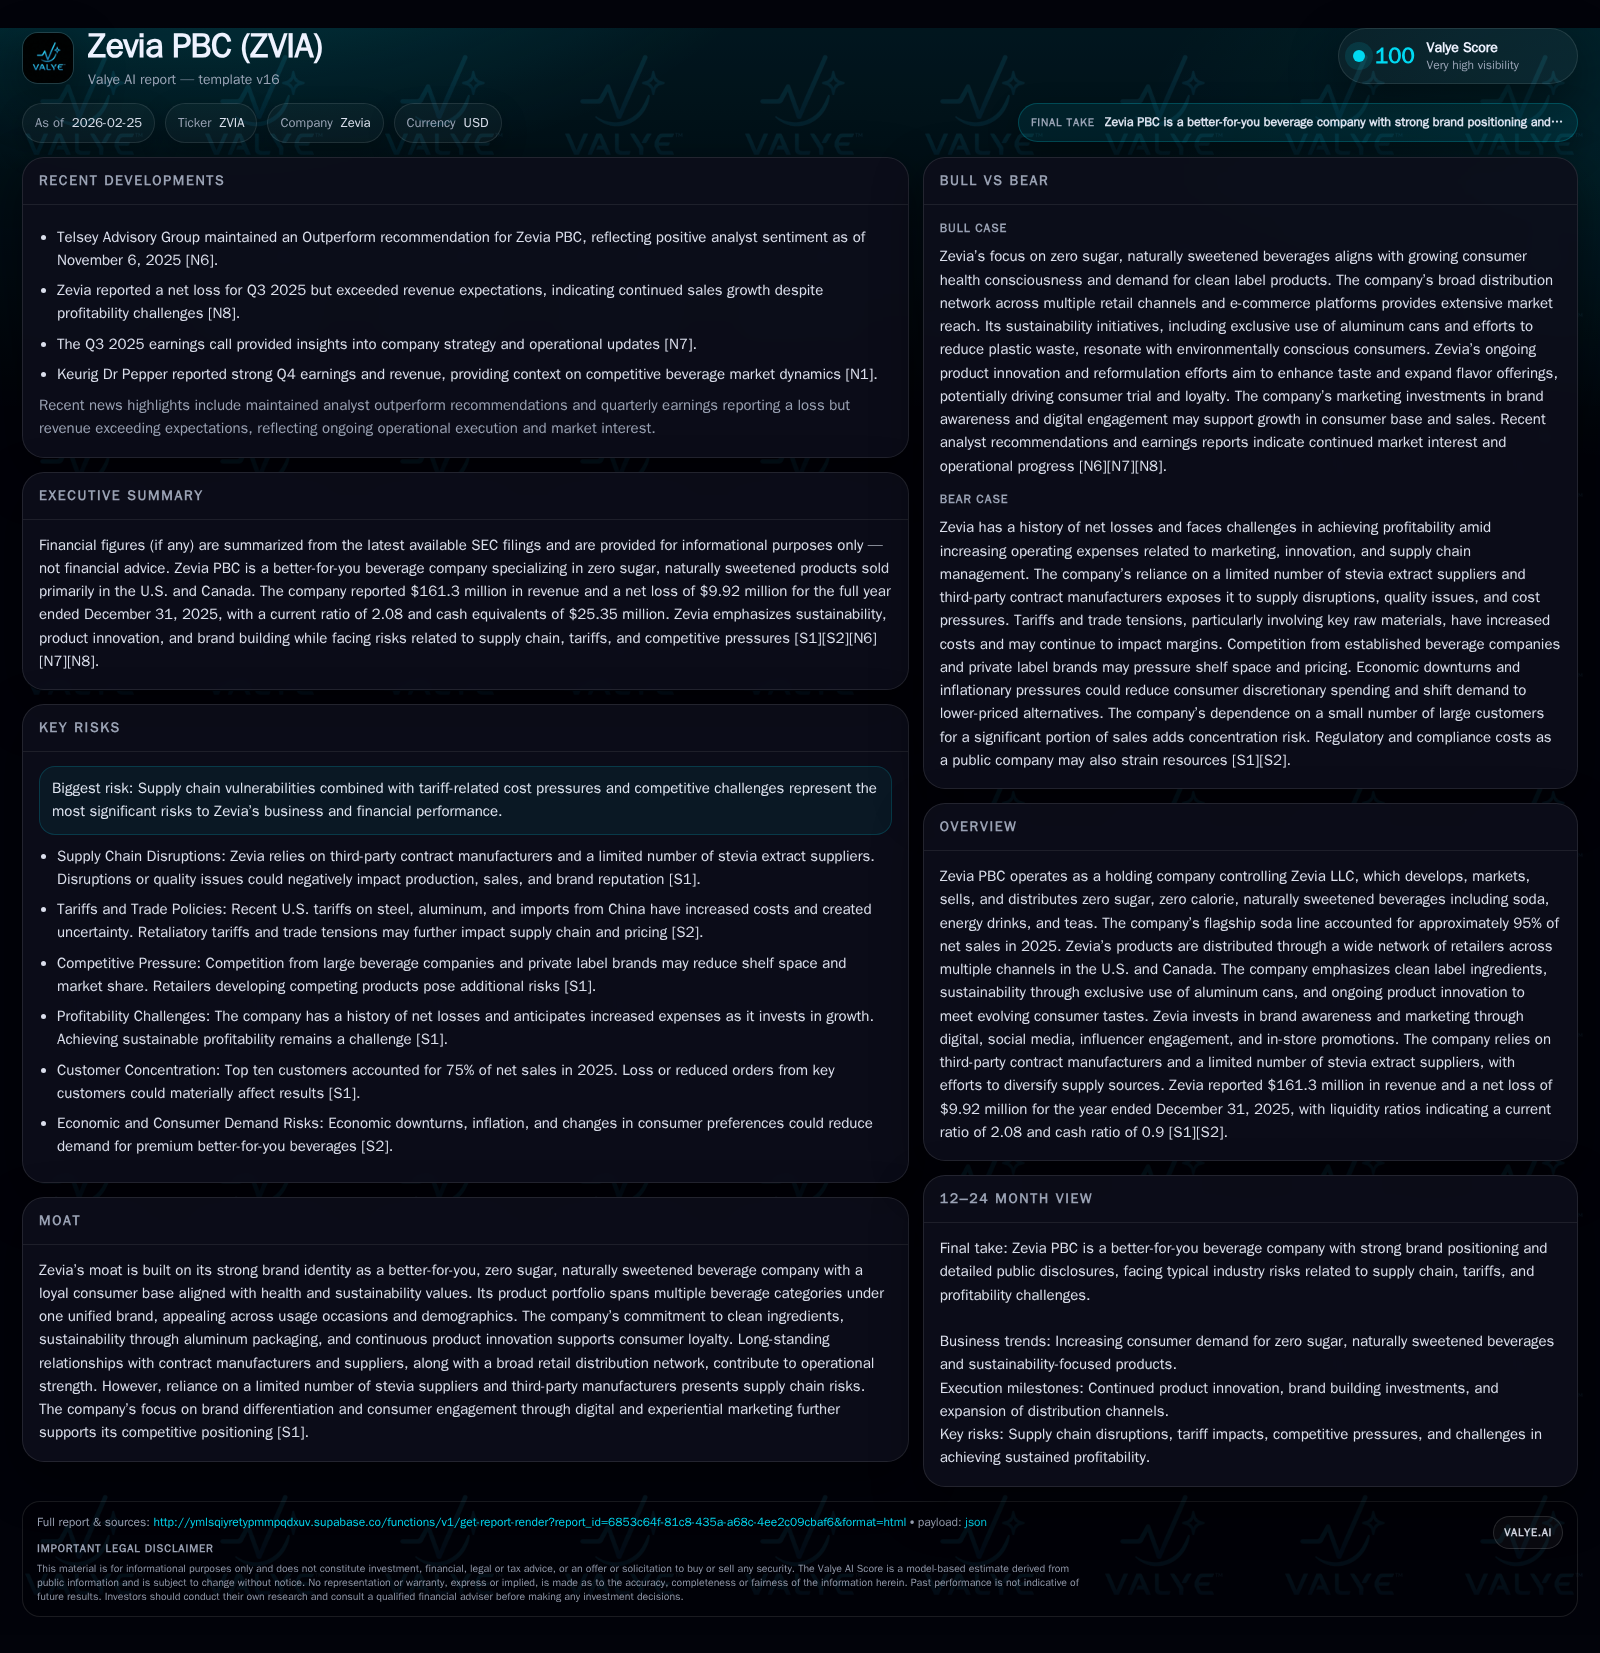
Zevia PBC’s Growth Trajectory: Balancing Brand Strength Amid Operating Losses
Zevia PBC has rapidly scaled its clean-label beverage revenue while grappling with persistent operating losses and navigating capital constraints.
Zevia PBC’s revenue surged from $35 million in 2022 to over $161 million in 2025, driven primarily by consumer demand for zero-sugar, naturally sweetened beverages. Despite this growth, operating losses remain sizable though have narrowed over time. The company faces profitability headwinds from tariff-driven cost pressures, a reliance on contract manufacturing, and heavy marketing investments. Zevia’s brand moat—anchored in clean label and sustainability commitments—fuels consumer loyalty but supply chain concentration and regulatory scrutiny introduce risks. Liquidity remains adequate but free cash flow deficits and covenant constraints underscore the need for disciplined capital allocation as the company balances growth aspirations with financial rigor.
From Startup Growth to Market Established: Zevia’s Revenue and Expense Evolution
Zevia PBC has demonstrated remarkable revenue growth over recent years, scaling from $35.4 million in FY2022 to $161.3 million in FY2025—an increase of approximately 355%, fueled by rising consumer demand for clean-label and zero sugar beverages across U.S. and Canadian retail channels [F1].
Despite top-line momentum, operating income remains negative, reflecting ongoing margin pressures. Operating losses increased from -$6.3 million in FY2022 to a peak of -$23.7 million in FY2024 before improving to -$11.8 million in FY2025 [F1]. Net losses have similarly narrowed from early startup levels (-$37.4 million in FY2021) to -$9.9 million most recently.
Operating cash flows have remained negative throughout this period, with the latest year recording -$4.7 million alongside minimal capital expenditures ($0.3 million), indicating a focus on brand development and contract manufacturing rather than asset-heavy investments [F1].
Historical performance (annual)
| FY | Rev ($mm) | Net ($mm) | CFO ($mm) | OpInc ($mm) | Rev YoY | Net YoY |
|---|---|---|---|---|---|---|
| 2025 | 161 | -10 | -5 | -12 | +4.0% | |
| 2024 | 155 | -1 | -24 | +310.2% | ||
| 2023 | 38 | -9 | -16 | -9 | +6.9% | -48.3% |
| 2022 | 35 | -6 | -21 | -6 | +83.5% |
Source: SEC companyfacts cache [F1].
Note: Some line items are omitted where multi-year comparability is limited in the structured SEC XBRL dataset; trend columns are shown only when comparable history exists.
Capital returns and efficiency (annual)
| FY | FCF ($mm) | ROE% |
|---|---|---|
| 2025 | -5 | -19.4 |
| 2024 | ||
| 2023 | -10.2 | |
| 2022 | -23 | -5.6 |
Source: SEC companyfacts cache [F1].
Table reflects annual figures sourced from company filings; YoY percentages where available [F1]
Key Drivers Behind Zevia’s Revenue Growth and Their Evolution
The core driver of revenue growth remains Zevia’s flagship zero sugar soda line, which accounted for about 95% of net sales in 2025, emphasizing strong consumer loyalty to this product category . The company has also expanded into naturally sweetened teas and energy beverages targeting adjacent health-focused segments—a strategic move amid intensifying competition [N1][S1][S2].
Distribution has broadened across multiple retail channels including grocery, drug stores, warehouse clubs, mass merchants, natural stores, and e-commerce platforms.
Marketing efforts emphasize digital channels through social media campaigns, influencer partnerships, and experiential activations that reinforce sustainability narratives such as exclusive use of aluminum cans known for their recyclability and lower environmental footprint compared to plastics .
Supply chain challenges include reliance on a limited number of stevia extract suppliers (primarily three), selected for their proprietary blends essential to Zevia’s taste profile [S11][S27]. Trade tensions between the U.S. and China have introduced tariff surcharges impacting raw material costs.
Charting Future Growth: Innovation, Distribution Expansion & Supply Chain Risks
Looking forward, Zevia is positioned to benefit from sustained consumer shifts toward better-for-you beverages emphasizing transparency and natural ingredients; however, supply chain dependencies may limit upside potential.
Tariffs on aluminum cans implemented mid-2025 increased packaging costs significantly—initially at 25%, rising to as much as 50%—complicating cost management strategies [S2]. Retaliatory tariffs by Canada further add complexity to cross-border trade.
Innovation pipeline efforts must continue adapting to evolving taste preferences with more functional and flavored beverages while sustaining packaging innovations that support brand loyalty [N1][S27]. Channel growth opportunities focus on expanding e-commerce presence and strengthening penetration into club stores where larger pack formats command premium pricing.
Mitigating single-source production risks includes pursuing additional contract manufacturing partnerships to reduce exposure caused by third-party bottlenecks or competitive conflicts at existing plants [S11][S25]. Monitoring political and trade policy developments remains critical for margin discipline.
Profitability Outlook: Structural Challenges & Operating Loss Trends
Despite robust revenue gains, profitability remains elusive due to structural factors:
- Outsourced manufacturing exposes costs vulnerable to inflationary pressures on raw materials plus tariff escalations limiting gross margin improvements despite scale gains [F1][S2]
- Significant marketing investments necessary for brand awareness against established beverage giants result in high SG&A expenses offsetting operational leverage benefits.
Operating losses improved by about half year-over-year from nearly $24 million in FY2024 to roughly $12 million in FY2025 but still reflect near-term profitability challenges requiring efficiency improvements or pricing enhancements [F1][S4]. Tariff-related cost inflation remains a key threat without successful mitigation.
Capital Structure & Cash Flow Discipline: Debt Covenants & Cash Burn
Liquidity at fiscal year-end 2025 was sound with cash balances exceeding $25 million versus current liabilities near $28 million for a current ratio over 2x — indicating adequate short-term financial health [F1].
However, free cash flow remains negative around $5 million due to persistent operating cash flow deficits partially offsetting minimal capital expenditure primarily supporting operational infrastructure rather than capacity expansion [F1][S4][S5].
Covenants tied to the credit facility include fixed charge coverage ratio minimums that could restrict strategic initiatives such as product launches or channel expansions if thresholds are breached [S4][S5]. Noncompliance could accelerate debt repayment obligations or force dilutive equity raises.
Brand Identity & Competitive Moat: Clean Label Drives Consumer Loyalty
Zevia’s competitive advantage stems from its clean label positioning offering zero-calorie sodas sweetened exclusively with natural stevia extracts rather than artificial sweeteners common among competitors .
This is complemented by a commitment to sustainability through exclusive aluminum can use—an ecological differentiator embraced by environmentally conscious consumers.
Marketing strategies prioritize digital-first approaches including influencer activations targeting younger demographics valuing authenticity and transparency—all reinforcing long-term brand loyalty despite intense competition.
Risks: Tariffs, Supplier Concentration & Regulatory Scrutiny
Key risks include:
- Volatile tariffs on metals used for cans injecting cost unpredictability that may erode margins absent effective price pass-through or supply alternatives [S2][S25]
- Supplier concentration risk given dependence on few stevia extract vendors vulnerable to geopolitical tensions affecting supply continuity or pricing volatility [S11]
- Regulatory scrutiny over "natural" labeling claims under FTC/FDA frameworks increasing litigation risk with class action lawsuits common across better-for-you food & beverage sectors potentially leading to fines or mandatory label changes harming reputation [S6][S7][S8]
- Compliance burdens from emerging multi-jurisdictional data privacy laws impacting marketing operations reliant on behavioral targeting technologies [S13]
- High customer concentration risk as top ten customers represent 75% of sales; shifts by major retailers toward private labels could materially impact sales volumes or shelf space availability negatively affecting results [S20]
Financial Metrics Summary: ROE & Cash Flow Implications for Investors
Financial metrics highlight ongoing challenges balancing growth with profitability:
- Return on Equity approximates -19.4%, reflecting continued net losses against an equity base near $51 million at end-2025 signaling limited capital returns during growth investment phase [F1]
- Negative operating cash flow intensified recently (-$4.7M in FY2025 vs prior year) combined with minimal capex results in free cash flow deficits near $5M underscoring need for margin improvement or new capital inflows [F1]
- Debt covenant restrictions compound risks making any deleveraging or refinancing efforts crucial absent clear paths toward positive EBITDA generation soon.
Overall, Zevia exhibits strong top-line growth driven by favorable macro trends but faces structural cost challenges delaying profit realization requiring close monitoring of expense controls, tariff impact mitigation, supply diversification outcomes, and regulatory compliance.
This analysis is based solely on publicly available information as of February 25, 2026 including SEC filings and recent news coverage without any forward-looking investment recommendations.
Disclaimer: This is research-only, informational analysis and not investment advice. It may include AI-generated interpretation and general industry context. Always verify important details using primary sources.
Comments