
Amphastar Pharmaceuticals: Reported Liquidity Position, Margin Questions, and the Realities of Generic Drug Competition
The company’s capital position and execution offer a buffer, yet future margin durability and product pipeline momentum will determine if current strength can translate into sustained outperformance.
Amphastar Pharmaceuticals reported strong Q3 2026 results and maintains a significant reported cash balance with no long-term debt, but faces industry-wide pricing and regulatory headwinds. Analyst expectations of potential earnings declines highlight the need to scrutinize the sustainability of recent profitability. Monitoring margin trends, pipeline progress, and competitive actions will be critical to assessing Amphastar’s ability to maintain its current trajectory. [S2] [N1] [N4]
Amphastar Pharmaceuticals, a player in the competitive generic and specialty pharmaceuticals market, has posted a strong third quarter with both revenue and earnings exceeding analyst expectations. However, the generic drug sector’s notorious pricing pressure and ongoing regulatory hurdles cast uncertainty on whether Amphastar’s recent margin performance is sustainable. Analyst commentary already points to possible earnings contraction ahead, highlighting the importance of monitoring operating leverage, product mix evolution, and competitive dynamics as the company charts its next phase.
Strong Q3 Performance and Pristine Balance Sheet Anchor Near-Term Outlook
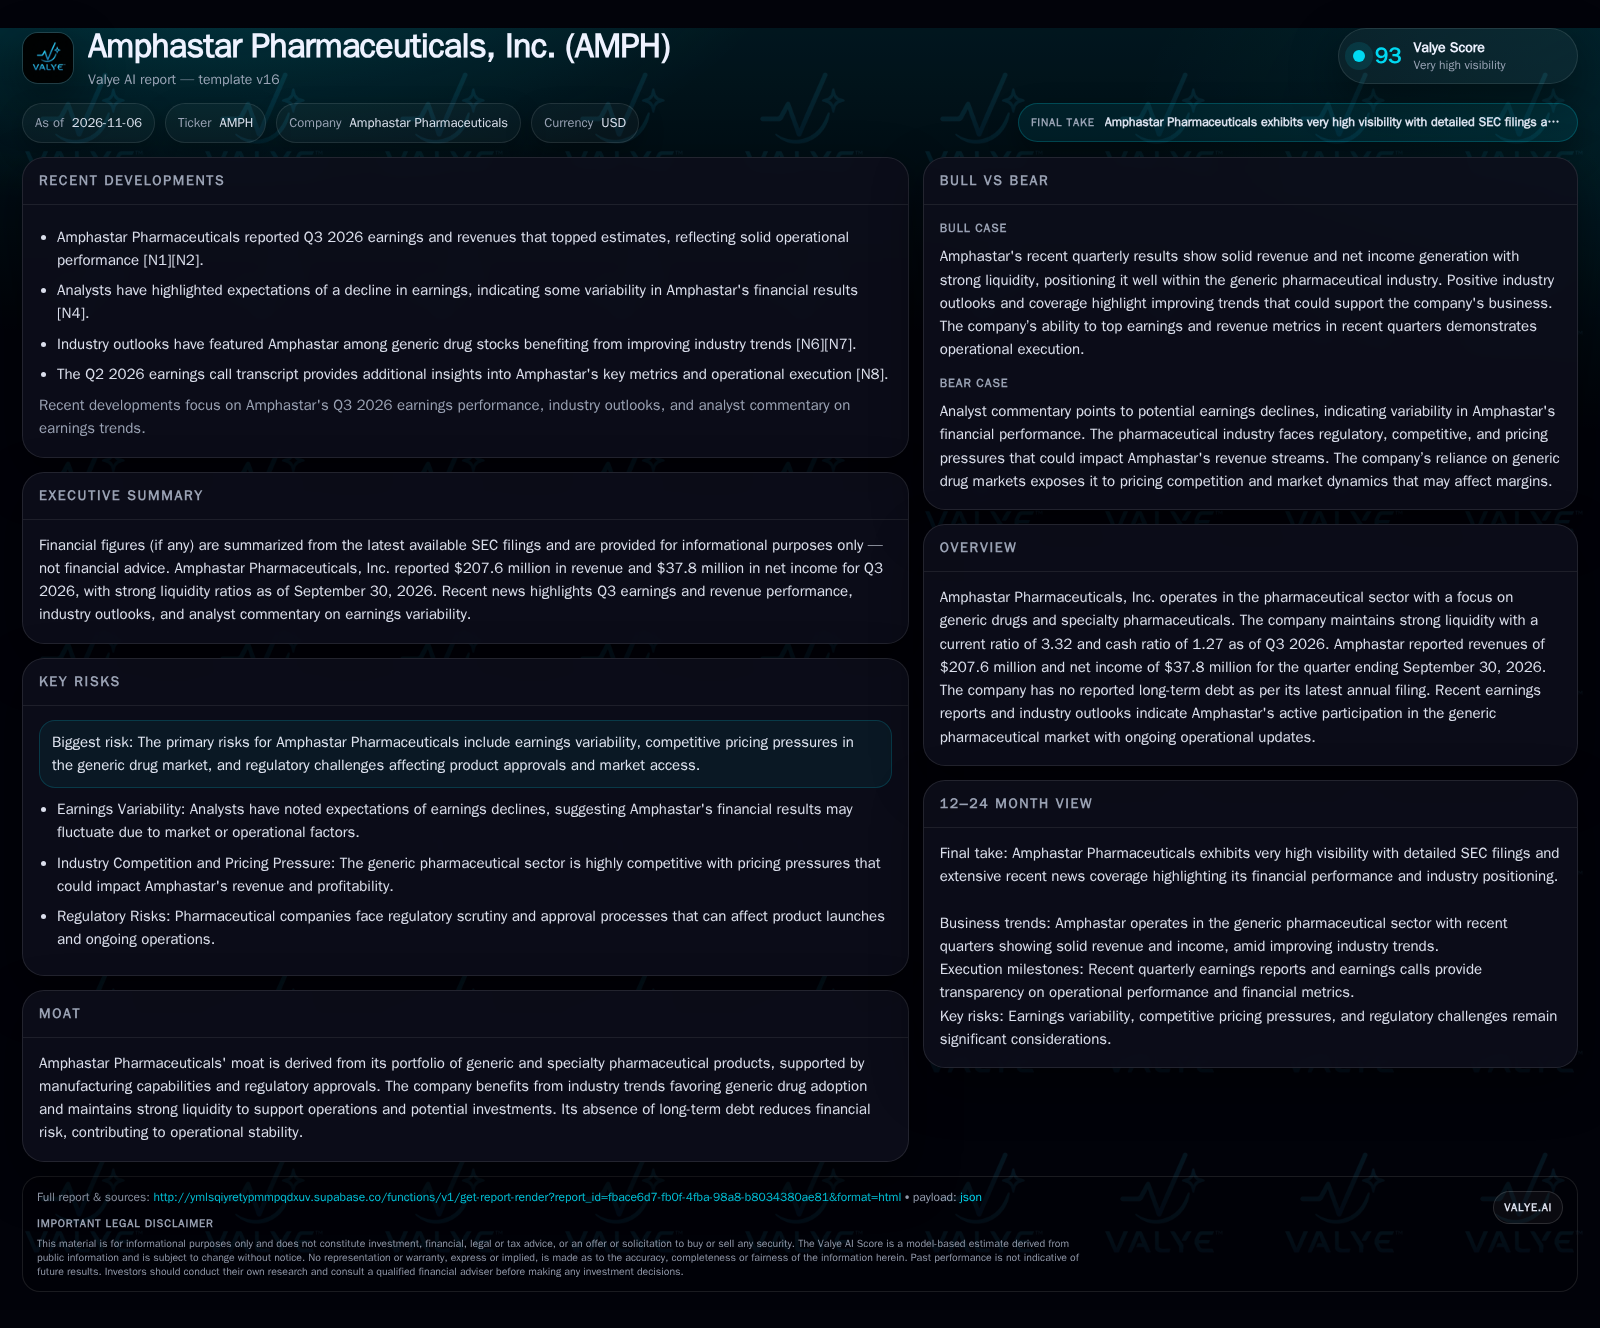
Amphastar Pharmaceuticals reported $207.6 million in revenue and $37.8 million in net income for Q3 2026, exceeding analyst estimates for the quarter [S2] [N1] [N2]. This performance was coupled with a reported liquidity position: as of September 30, 2026, the company held $204.6 million in cash and equivalents and $26.0 million in short-term investments, totaling $230.6 million in liquid assets. The current ratio stood at 3.32, and the cash ratio at 1.27, while Amphastar reported no long-term debt [S2] [S1]. The company reported cash and liquidity metrics for the period; these figures do not by themselves establish operating runway, investment capacity, financial flexibility, or financing capacity. However, analysts have also highlighted expectations of earnings declines in future quarters, indicating that this outperformance may not be linear or durable [N4].
How Amphastar’s Model Converts Volume and Product Mix into Profit
Amphastar’s economics are rooted in the high-volume, low-to-moderate-margin world of generic pharmaceuticals, with incremental specialty products offering potential for higher contribution margins. Revenue is driven by unit sales of approved generics and select proprietary products, where pricing is typically dictated by competitive intensity and payer negotiations. The company’s reported profitability in Q3 2026 suggests current mix and scale are sufficient to absorb fixed costs, but gross margins can be highly sensitive to both product mix and industry-wide pricing pressure.
With no long-term debt and a cash-rich balance sheet, Amphastar’s capital needs are primarily for R&D, regulatory submissions, and incremental capacity investments rather than debt service. Fixed costs in manufacturing and regulatory compliance are material, but the business can exhibit operating leverage when volumes rise or when higher-margin products gain share. Conversely, price erosion—a frequent occurrence in generics—can quickly erode margins, especially if new competitors enter key product categories.
Generic Drug Rivalry and the Battle for Margin Resilience
Amphastar competes in a sector characterized by intense rivalry among generic manufacturers, including large diversified players and focused niche competitors. Barriers to entry such as regulatory approval, manufacturing scale, and supply chain reliability are meaningful but not insurmountable, and few generic products retain exclusivity for long. The company’s portfolio breadth and ability to secure regulatory approvals support its position, but pricing power is typically limited except in temporary supply disruptions or for specialty products.
Substitution risk is high—buyers can often switch suppliers based on price or availability—placing a premium on cost efficiency and manufacturing reliability. Amphastar’s liquidity and debt-free posture are advantages in absorbing shocks or funding product launches, but do not guarantee long-term moat. The ability to develop or acquire products with less direct competition, or to leverage manufacturing capabilities for complex generics or specialty injectables, may offer some margin insulation if executed well. However, the industry’s history of rapid price erosion and customer churn means that even strong operators must continually innovate or scale to maintain profitability.
Margin Expansion Through Specialty Mix and Operational Discipline
If Amphastar can accelerate the shift toward higher-margin specialty pharmaceuticals or complex generics, the company may achieve sustained margin expansion even in a tough pricing environment. Continued outperformance relative to peers—demonstrated by beating analyst estimates in Q3—would be confirmed if subsequent quarters show stable or rising gross margins and net income despite broader industry headwinds [S2] [N1] [N2].
Upside would also be supported by successful regulatory approvals for new products, positive pipeline updates, and execution on manufacturing scale advantages. Evidence of differentiated pricing power (e.g., limited competition in certain categories) and successful entry into less commoditized segments would further bolster the thesis. Confirmation would come from disclosures of revenue mix improvement toward specialty or branded generics, and from seeing operating leverage in SG&A and R&D as new products contribute. Falsification would occur if margins deteriorate despite revenue growth, or if new launches fail to offset price erosion in legacy products.
Sustained Profitability Amid Cyclical Pricing and Regulatory Challenges
The most plausible trajectory is that Amphastar continues to generate solid revenues and profits, but with periodic earnings volatility driven by industry pricing cycles, regulatory approvals, and competitive launches. Margins may fluctuate as older products face price erosion and new launches ramp unevenly.
Evidence supporting this scenario would include continued positive net income, stable revenue trends, and maintenance of a reported current ratio, even as quarterly margins show some variability. This scenario would be falsified if the company experiences sustained margin compression, repeated regulatory setbacks, or if it is unable to replace revenue lost to pricing or competition with successful new launches.
Earnings Contraction Driven by Price Wars and Pipeline Delays
The primary risk is that Amphastar’s earnings contract meaningfully as competitive intensity triggers price wars in its core generic markets, and/or regulatory or manufacturing setbacks delay the launch of higher-margin products. If price erosion outpaces the company’s ability to add differentiated products, gross margins and net income could decline sharply, validating analyst concerns of future earnings drops [N4].
Downside would be confirmed by a sequence of quarters with falling gross margins, declining net income, and stagnant or falling revenue despite industry growth. Additional warning signs would include negative pipeline updates, regulatory setbacks, or unexpected cash outflows that erode the company’s liquidity cushion. The absence of new product approvals or loss of supply contracts would further pressure results.
Milestones That Will Determine If Amphastar’s Outperformance Is Sustainable
Gross margin and operating margin trends by quarter—evidence of margin durability or compression would be critical in testing the sustainability of recent performance.
Revenue mix evolution, particularly the share of specialty or complex generics versus commoditized products—a useful metric would be product line contribution if disclosed.
R&D pipeline updates and regulatory approval timelines for new products—positive momentum would support future growth; delays would signal risk.
Competitive landscape changes, such as major new entrants or exits in key product categories, which could alter pricing dynamics.
Cash flow from operations and capital allocation decisions—sustained positive cash flow and disciplined investment would reinforce the company’s balance-sheet strength.
Quarterly net income variability—persistent volatility could indicate underlying margin fragility or over-reliance on a narrow set of products.
Disclosures of supply chain disruptions or manufacturing issues, which could impact both cost structure and revenue continuity.
If disclosed, customer concentration metrics—heavy reliance on a small number of buyers would increase risk in a price-sensitive market.
Disclaimer: This is research-only, informational analysis and not investment advice. It may include AI-generated interpretation and general industry context. Always verify important details using primary sources.

Comments