
AutoNation’s Scale and Finance Product Mix Buffer Cyclical Vehicle Sales Pressure
AutoNation’s Q2 2026 results exhibit resilience through integrated finance and service offerings amid shifting vehicle sales dynamics.
In its latest quarterly filing ending June 30, 2026, AutoNation reported nuanced changes in receivables and service contract revenue indicative of evolving sales mix and financing strategies [S2]. The company's entrenched dealership network enables it to offset some economic headwinds in new and used vehicle sales through expanded finance and insurance (F&I) income and after-sales services [S1]. However, its current liquidity ratios reflect industry capital intensity and operational leverage that require monitoring amid competitive and economic risks [F1]. Growth hinges on F&I penetration, used vehicle market trends, and operational scale, with peer dynamics exemplified by firms like Lithia Motors and CarMax providing comparative context. Investors and analysts should focus on key disclosure metrics such as same-store sales growth, gross profit per unit, and receivables quality in upcoming quarters.
Recent Operating Update Highlights
AutoNation’s Q2 2026 filings highlight meaningful shifts in its receivables composition that suggest underlying changes in the customer financing environment as well as adjustments in inventory turnover rhythms. Specifically, contracts-in-transit and vehicle receivables decreased to $366.7 million from $485.7 million at year-end 2025 while trade receivables rose modestly to $200.4 million from $172.6 million [S2]. Manufacturer receivables declined somewhat to $199.0 million compared to $230.6 million previously. These dynamics point to less capital tied up in vehicles awaiting title transfer or sale completion yet stable receivables from supplier credits and direct trade transactions. Additionally, allowances for credit losses held steady around $3 million reflecting consistent credit risk management.
The company reported revenue expected from Vehicle Care Protection (VCP) contracts of approximately $117.2 million over the next five years—$41.5 million expected within the next 12 months—indicating a strong embedded recurring revenue base from after-sales service agreements [S2]. This line acts as a valuable buffer against volatility in vehicle sales volume.
Business Model Specifics
AutoNation operates primarily through an extensive physical dealership network spanning domestic, import, and premium luxury vehicle brands. Its revenue streams are multi-faceted: direct new vehicle sales generate top-line volume impacted by consumer demand cycles; used vehicle transactions offer both volume and margin leverage but are more sensitive to resale value fluctuations; parts and after-sales services provide steady fee-based income with higher margins; finance and insurance (F&I) products monetize extended payment plans, warranties, insurance offerings, and service contracts creating recurring income improving overall profitability during downturns [S1]
The company typically sells vehicles through retail customers who may finance purchases via AutoNation's captive or third-party financings reflected by sizable auto loans receivable portfolios stratified by credit tiers with weighted average FICO scores ranging around low 700s for its highest-quality segment [S2]. This exposure to consumer credit makes financing conditions a critical lever for revenue stability.
Margins depend heavily on average gross profit per unit sold combined with the penetration rate of F&I products often measured as net F&I income per vehicle transaction. After-sales absorption rate—the extent to which fixed costs are covered by parts/service revenues—is another key profitability driver benefiting from service contract renewals fostering customer retention.
Industry Structure and Competitive Positioning
AutoNation is positioned among large multi-brand automotive dealership groups alongside peers such as Lithia Motors and CarMax who share similar business models combining scale with diversified portfolios of new/used sales plus service offerings. Compared to regional dealerships or online-only platforms like Carvana, AutoNation leverages physical presence density enabling enhanced customer experience through convenience of location combined with comprehensive service centers enhancing lifetime value of customers.
Competitive pressure arises not only from traditional operators but increasingly from e-commerce enabled disruptors emphasizing digital convenience which requires AutoNation to invest simultaneously in omnichannel capabilities whilst protecting physical showroom appeal.
Growth Drivers
Growth prospects hinge on several vectors: first is the penetration expansion of finance & insurance products which tend to have higher margins than core vehicle sales and provide revenue resilience amid softer unit volumes. Second is the growth trajectory in used vehicle markets supported by increased trade-ins due to longer ownership cycles for new car buyers coupled with supply chain normalization easing inventory constraints historically pressuring prices.
Thirdly, enhancing after-sales revenue represents a structural opportunity; increasing customer retention through service contracts together with collision center expansions can lift margin profile since these channels are less economically sensitive than upfront sales.
Technological investments aimed at improving inventory turnover rate—reducing days supply while avoiding stockouts—also bolster gross profit margins by optimizing purchasing aligned with demand forecasts.
Finally, selective dealership acquisitions or brand partnerships could provide incremental scale advantages if executed prudently.
Risks / Constraints
AutoNation faces considerable risks typical of automotive retail companies but amplified given its scale. Economic downturns directly dampen discretionary spending on vehicles causing cyclical declines in new/used unit volumes which form the bulk of revenue. Concurrently tightening consumer credit markets could reduce loan originations thereby lowering F&I product uptake weakening a key profit contributor [S1],[S2].
Inventory supply constraints caused by manufacturer production issues or shifts toward electric vehicles could limit available models or skew mix impacting margins. Price competition among dealerships can compress gross profits per unit particularly when manufacturers adjust incentives unpredictably.
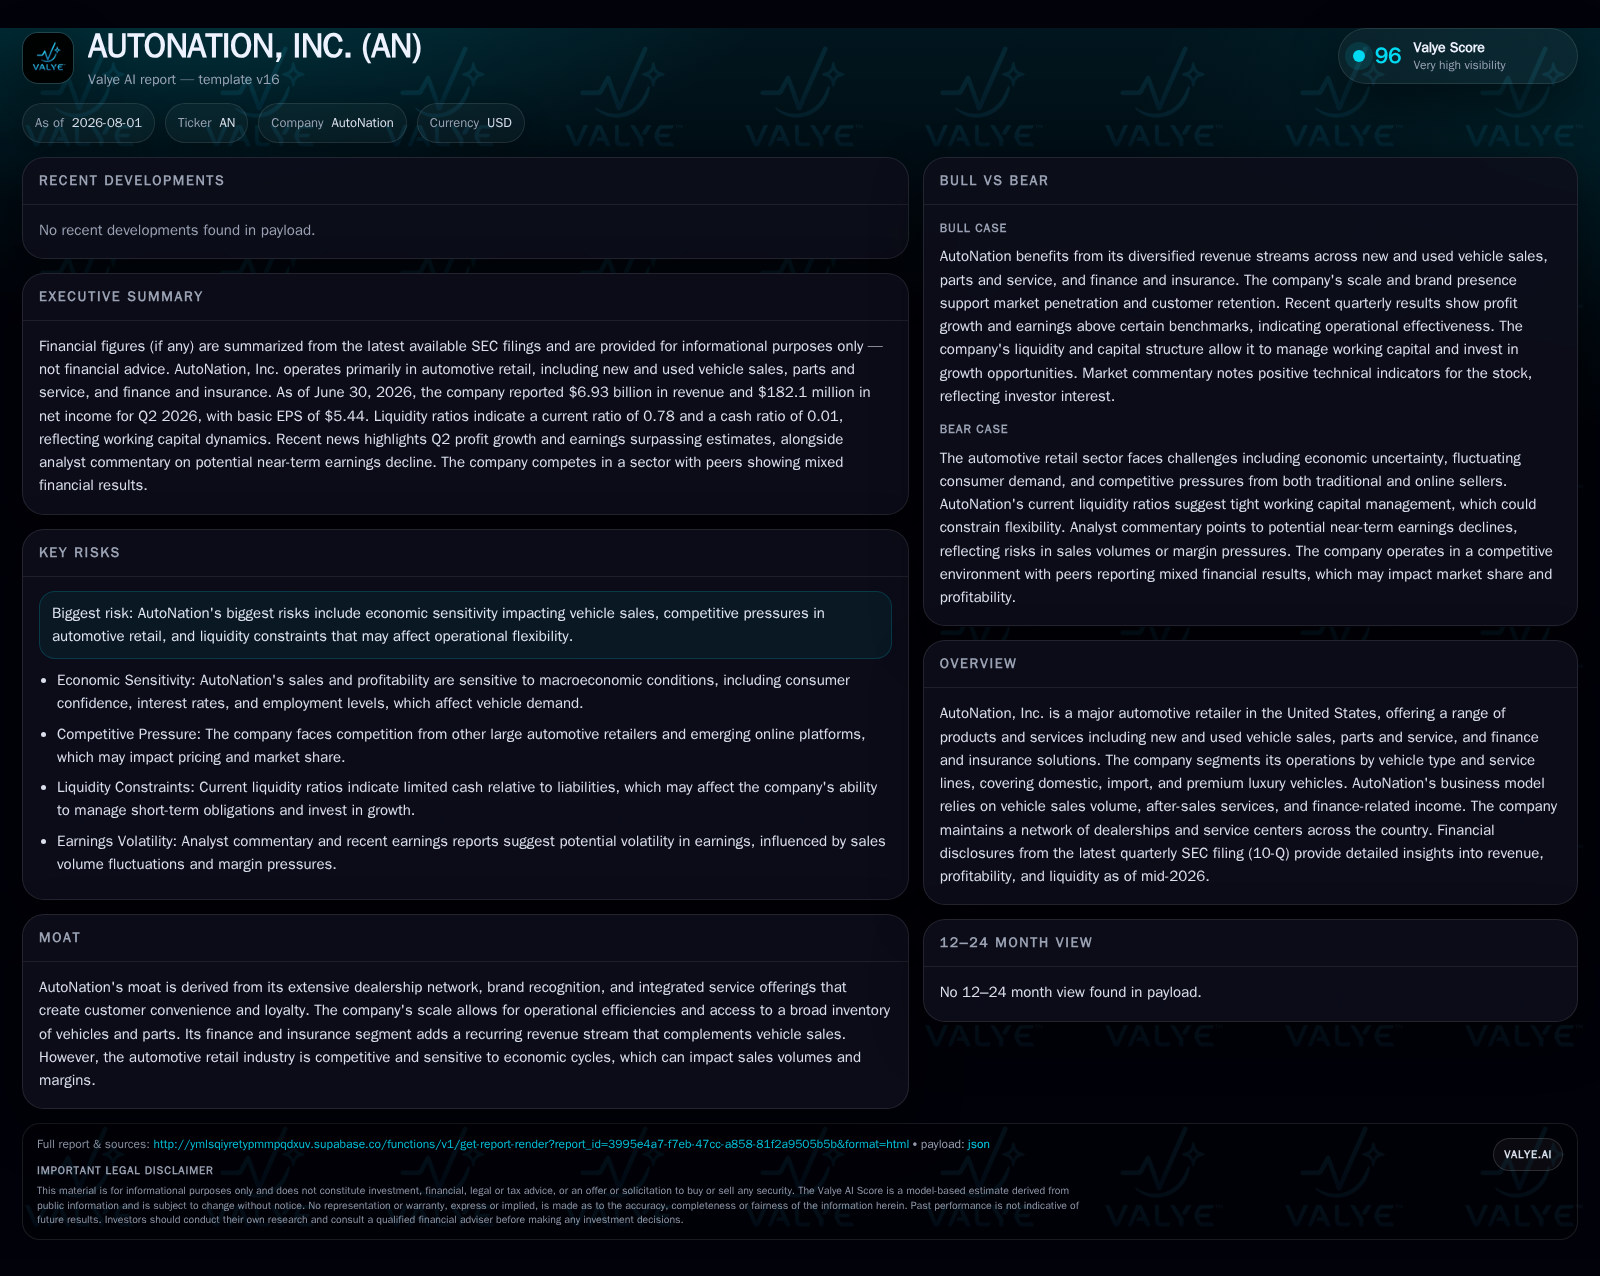
Liquidity remains constrained with a current ratio of approximately 0.78 reflecting significant short-term obligations relative to current assets including cash reserves totaling roughly $53 million against liabilities surpassing $6 billion indicating dependence on timely cash flow generation from operations [F1]. Interest cost exposure on approximately $3.7 billion debt underscores financial leverage risk especially if operating cash flow weakens during adverse conditions.
Shifting consumer preferences toward online direct-to-consumer models present a commercial challenge requiring sustained investment in digital capabilities without sacrificing showroom-driven sales advantages.
What to Watch Next
Key upcoming milestones include tracking same-store sales growth differentiated between new versus used segments revealing demand shifts potentially signaling macroeconomic trends. Monitoring average gross profit per unit sold will indicate pricing power sustainability or margin erosion.
Receivables quality deserves attention particularly aging analysis indicating levels of credit losses which affect net finance revenues. Changes in F&I income as a proportion of total vehicle transactions will illuminate success at cross-selling ancillary products vital for revenue stability.
Service absorption rates act as barometers for after-sales profitability progression; rising rates suggest stronger customer retention supportive of enterprise value.
Liquidity monitoring remains essential including quarterly updates on cash balances vis-à-vis short-term liabilities plus any refinancings or covenant adjustments serving as risk mitigants or red flags respectively.
Financial Profile Discussion
As of June 30, 2026, AutoNation held cash and cash equivalents near $53 million against current liabilities exceeding $6.1 billion resulting in a current ratio below one at approximately 0.78—a profile typical for capital-intensive automotive retailers reliant on fast inventory turnover coupled with dealer floorplan financing commitments [F1],[S2].
Net auto loans receivable expanded substantially compared to year-end 2025 reaching $2.59 billion net of credit loss allowances highlighting growing finance penetration though elevating exposure to consumer credit risk spread across differentiated credit tiers [S2]
Total debt stood around $3.7 billion as of end-2025 balancing conservatively against equity but necessitating close management focus on cash flow generation amid potential volatility stemming from economic cycles impacting core sales volumes [F1]
Overall operating margins derive benefit from recurring income streams such as F&I products along with parts/service revenues which partially offset volatility inherent in unit-based new/used vehicle sales making effective integration critical for sustaining profitable growth trajectories [S1],[S2].
Disclaimer: This analysis is intended solely for informational purposes without providing investment advice or research views regarding any securities.
Disclaimer: This is research-only, informational analysis and not investment advice. It may include AI-generated interpretation and general industry context. Always verify important details using primary sources.

Comments