
Franklin Resources: Profit Momentum, Asset Growth, and the Shifting Economics of Active Management
Franklin Resources’ recent financial results show a resurgence in profitability and assets under management, but long-term value hinges on its ability to sustain fee income and adapt to evolving client preferences in a competitive, fee-compressed asset management landscape.
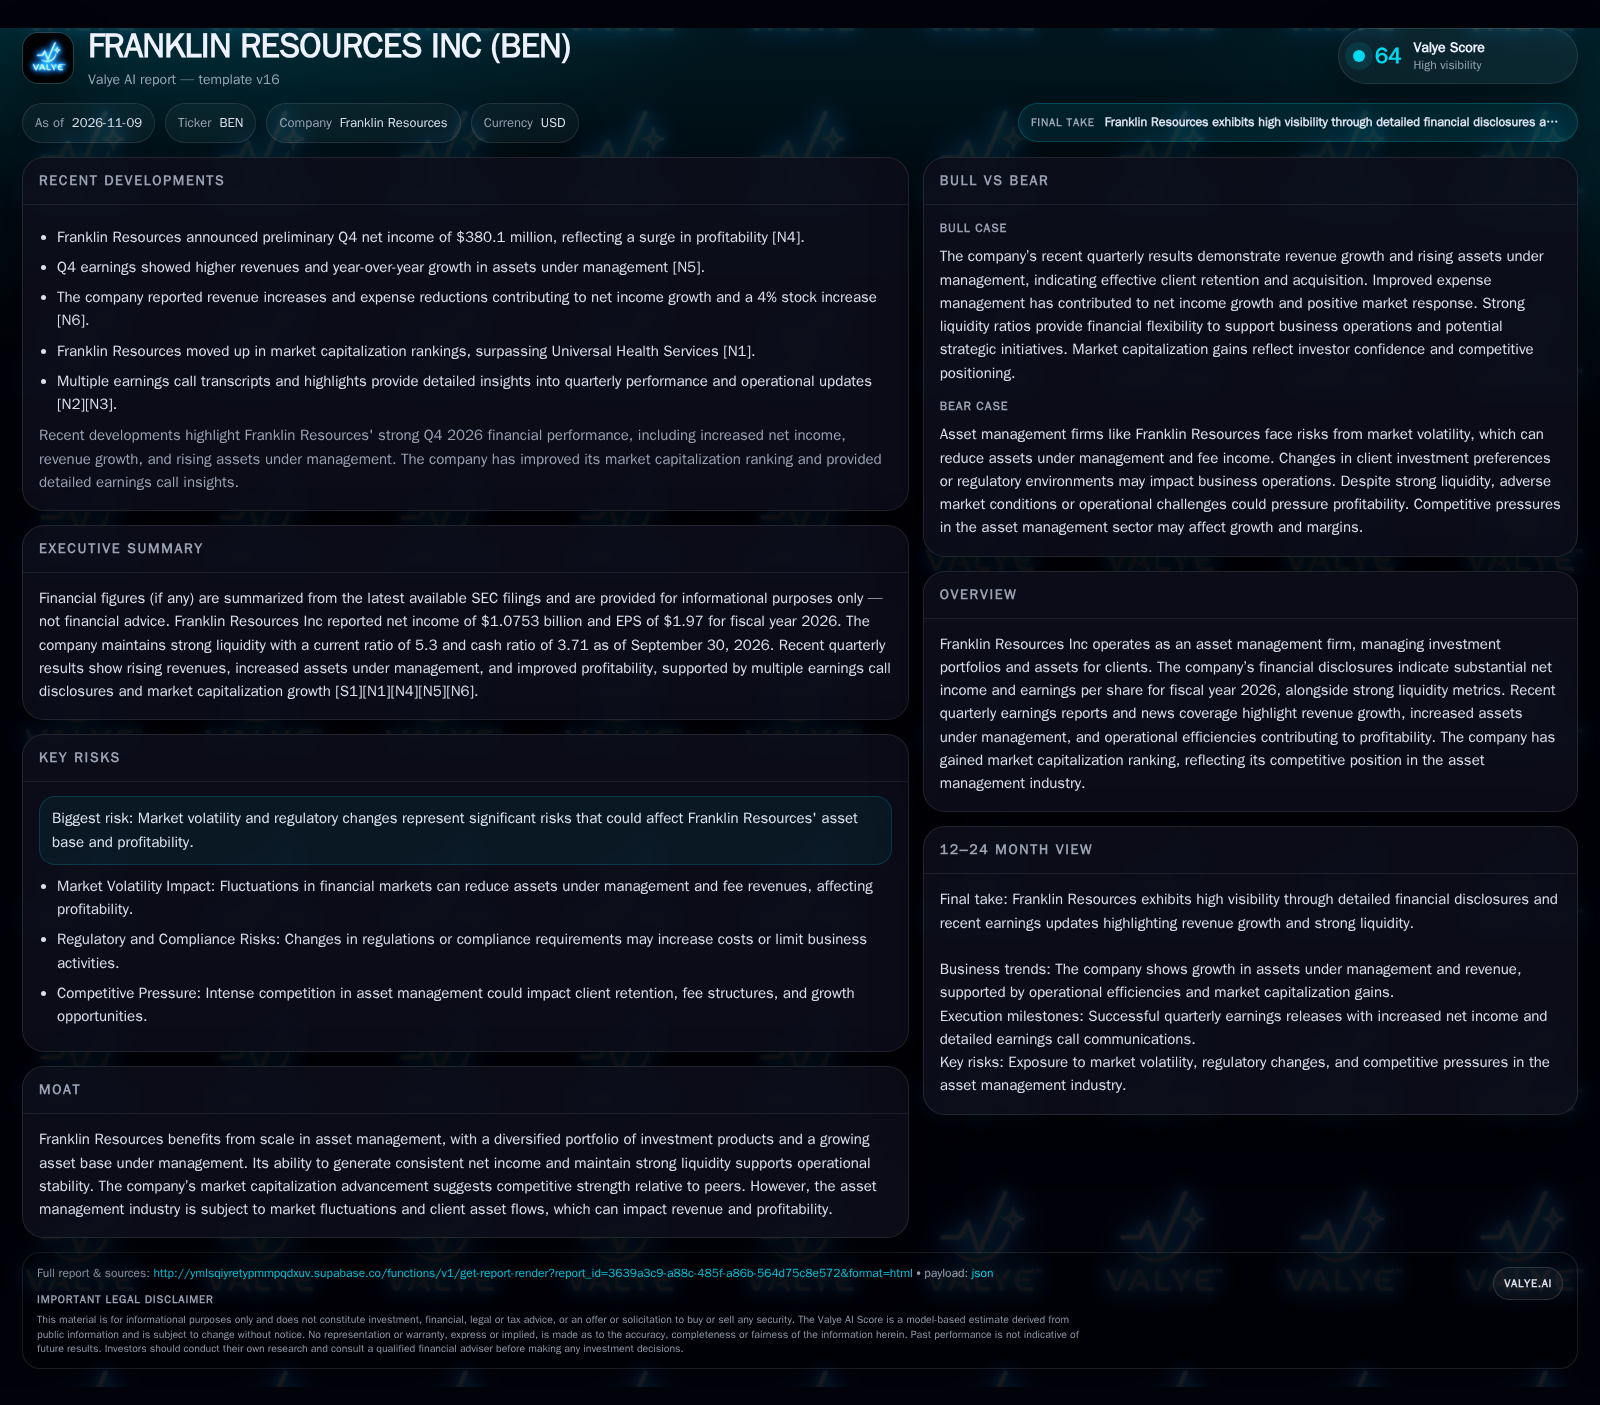
Franklin Resources reported strong fiscal 2026 results, including $1.0753 billion in net income and EPS of $1.97, supported by reported liquidity position and a rising asset base. Recent quarters have seen revenue gains, expense reductions, and a market capitalization climb, but the durability of these gains will depend on the company’s ability to navigate market volatility, maintain client asset inflows, and preserve margins as industry headwinds persist. [S1] [N4] [N5] [N6]
Franklin Resources’ latest results highlight a return to profit momentum, with both net income and assets under management rising in fiscal 2026. The company’s reported liquidity position and operational efficiencies have contributed to a positive market response and improved competitive standing. However, the sustainability of these gains will depend on Franklin’s ability to maintain asset inflows, manage fee pressure, and adapt to a rapidly evolving asset management industry characterized by increased competition, regulatory complexity, and shifting client demands.
Profit Recovery and Asset Growth Define Recent Performance
Franklin Resources reported net income of $1.0753 billion and basic/diluted EPS of $1.97 for the fiscal year ending September 30, 2026, reflecting a year of robust profitability [S1]. The company reported cash and liquidity metrics for the period; these figures do not by themselves establish operating runway, investment capacity, financial flexibility, or financing capacity. [S1] Preliminary Q4 2026 results showed net income surging to $380.1 million, supported by revenue increases and expense reductions [N4] [N6]. Furthermore, assets under management (AUM) rose year-over-year, directly supporting higher management fee revenue [N5]. The company’s improved financial performance has been recognized in market capitalization rankings, as Franklin surpassed Universal Health Services, indicating a strengthening competitive position in the sector [N1].
How Franklin Resources Converts AUM into Profits—and What Could Disrupt the Model
Franklin Resources generates the bulk of its revenue from management fees tied to assets under management, supplemented by performance fees and, in some product lines, distribution or advisory fees. The company’s cost structure is a mix of fixed costs (personnel, compliance, infrastructure) and variable expenses (distribution, incentive compensation), which creates operating leverage when AUM and revenues rise, as seen in the most recent quarter. Expense reductions contributed materially to profit gains in Q4 2026 [N6], but the sustainability of such efficiencies is always in tension with the need to invest in talent, technology, and regulatory compliance.
AUM growth is the primary volume driver—either through net client inflows or market appreciation. Fee rates are subject to competitive pressure, especially as clients migrate to lower-cost passive products and as institutional investors demand discounts for scale. Mix shifts (from higher-fee active equity mandates to lower-fee passive or fixed income) can compress margins even if headline AUM grows. Capital needs for an asset manager are modest compared to banks or insurers, but maintaining a reported liquidity position cushion supports business continuity, product launches, and, potentially, inorganic growth.
The interplay between fee structures and asset allocation within Franklin Resources’ portfolio is critical to understanding profit dynamics. If the firm experiences a shift toward lower-margin products, such as passive or fixed income funds, the average fee per dollar of AUM could decline even amid nominal asset growth. This effect underscores the importance of product mix management and client segmentation strategies. Additionally, the company’s ability to cross-sell higher-margin offerings or alternative investments could mitigate fee pressure. However, such strategies require sustained investment in specialized talent and technology platforms, which may increase fixed costs and compress short-term margins, presenting a trade-off between growth initiatives and near-term profitability.
Defending Share in a Fee-Compressed, Hyper-Competitive Industry
Franklin Resources competes with a wide range of global asset managers, including independent firms, bank-affiliated asset managers, and insurance-owned platforms. The industry is characterized by intense competition for both institutional and retail assets, with barriers to entry relatively low for new digital or specialized entrants. Scale can confer distribution advantages, operational efficiencies, and negotiating power with service providers, but it is not a guarantee of client retention—especially as clients become more fee-sensitive and performance-aware.
Potential substitutes include passive index funds, ETFs, and direct indexing solutions, all of which have grown rapidly and pressured active management fees. Competitive counterforces include the commoditization of beta, regulatory scrutiny on fee transparency, and the rise of digital wealth management platforms. Franklin’s climb in market capitalization rankings suggests recent relative strength, but maintaining this position will require continued AUM growth, product innovation, and demonstrable investment performance.
Scale advantages in asset management extend beyond cost efficiencies to include enhanced brand recognition and broader distribution networks, which can be pivotal in client acquisition and retention. However, these advantages are conditional on the firm’s ability to demonstrate consistent investment performance and innovation in product offerings. In a fee-compressed environment, differentiation through proprietary research, ESG integration, or thematic strategies can justify premium pricing but demands ongoing resource allocation. Conversely, failure to innovate or adapt to shifting investor preferences may result in client attrition to more nimble or specialized competitors, especially digital-first entrants that leverage technology to offer customized, lower-cost solutions.
AUM Inflows and Operating Leverage Drive a New Profit Cycle
The most favorable trajectory for Franklin Resources involves sustained net inflows into actively managed and differentiated strategies, allowing AUM to outpace both market volatility and client redemptions. This would enable the company to hold or modestly improve average fee rates, especially if product innovation attracts higher-value mandates or alternative asset flows. If expense discipline persists without sacrificing investment in core capabilities, operating leverage could further amplify profit growth, as evidenced by the recent surge in net income [N6].
Confirmation of this scenario would require consecutive quarters of positive net inflows (if disclosed), stable or rising average fee rates, and continued expense containment. Additional evidence could include market share gains in targeted asset classes, successful new product launches, and commentary on winning mandates from large institutional clients.
Sustained profit growth could also hinge on Franklin Resources’ capacity to leverage data analytics and digital platforms to enhance client engagement and operational efficiency. By integrating advanced analytics into portfolio management and distribution, the firm can identify emerging client needs and optimize product positioning. Moreover, digital tools can streamline compliance and reporting functions, reducing overhead and mitigating regulatory risks. If these investments lead to improved client retention and scalable distribution channels, Franklin could achieve a virtuous cycle of inflows and margin expansion. However, realizing these benefits requires effective change management and a willingness to reallocate resources from legacy processes to innovation-driven initiatives.
Profitability Holds Steady as Market and Fee Pressures Balance Growth
The most plausible near-term outcome is that Franklin Resources maintains profitability and stable or modestly rising AUM, but faces ongoing headwinds from fee compression and client migration to lower-cost solutions. Revenue may continue to grow at a moderate pace, supported by market appreciation and selective inflows, but margin expansion is likely capped by the need to reinvest in technology and distribution to defend against new entrants.
This scenario would be validated by stable quarterly earnings, modest growth in AUM, and fee rates that do not decline precipitously. Falsifying evidence would include a return to persistent net outflows, accelerating fee rate declines, or a sudden spike in expense growth that erodes operating leverage.
Market Volatility and Outflows Spark Margin Erosion
Adverse market conditions—such as a broad equity or bond market downturn—could rapidly shrink AUM, directly reducing fee revenue and pressuring profit margins. If clients accelerate shifts to passive or alternative providers, Franklin could experience net outflows that overwhelm market appreciation, forcing price competition and greater concessions on fee rates. Rising regulatory costs or failure to keep pace with digital transformation could further erode profitability.
Evidence for this scenario would include significant quarterly AUM declines (if disclosed), negative net flows, falling fee rates, or commentary about increased client attrition and rising compliance costs. A rapid deterioration in earnings or a material drop in market capitalization ranking would further substantiate downside risk.
Milestones That Will Test Franklin Resources’ Long-Term Profitability Thesis
Quarterly net client inflows or outflows, if disclosed, to assess whether organic AUM growth is sustainable.
Average fee rate trends by product segment—a key indicator of pricing power and mix shifts.
Expense growth relative to revenue, particularly in technology, distribution, and compliance.
Retention rates and performance rankings for flagship strategies, as these drive both inflows and brand value.
Market share changes within core asset classes, especially in active equities and fixed income.
Evidence of successful new product launches or entry into higher-margin alternative asset categories.
Management commentary on regulatory changes or competitive threats in earnings calls or filings.
Material changes in market capitalization ranking relative to industry peers.
Disclaimer: This is research-only, informational analysis and not investment advice. It may include AI-generated interpretation and general industry context. Always verify important details using primary sources.

Comments