
Benchmark Electronics in 2026: Margin Expansion, Sector Mix, and the Challenge of Program-Driven Cyclicality
Benchmark Electronics posted strong Q3 2026 growth, propelled by semiconductor capital equipment and advanced computing demand, with gross margin improvement and operational leverage. While sectoral breadth and global reach offer resilience, the business remains exposed to swings in customer program wins and international risk factors.
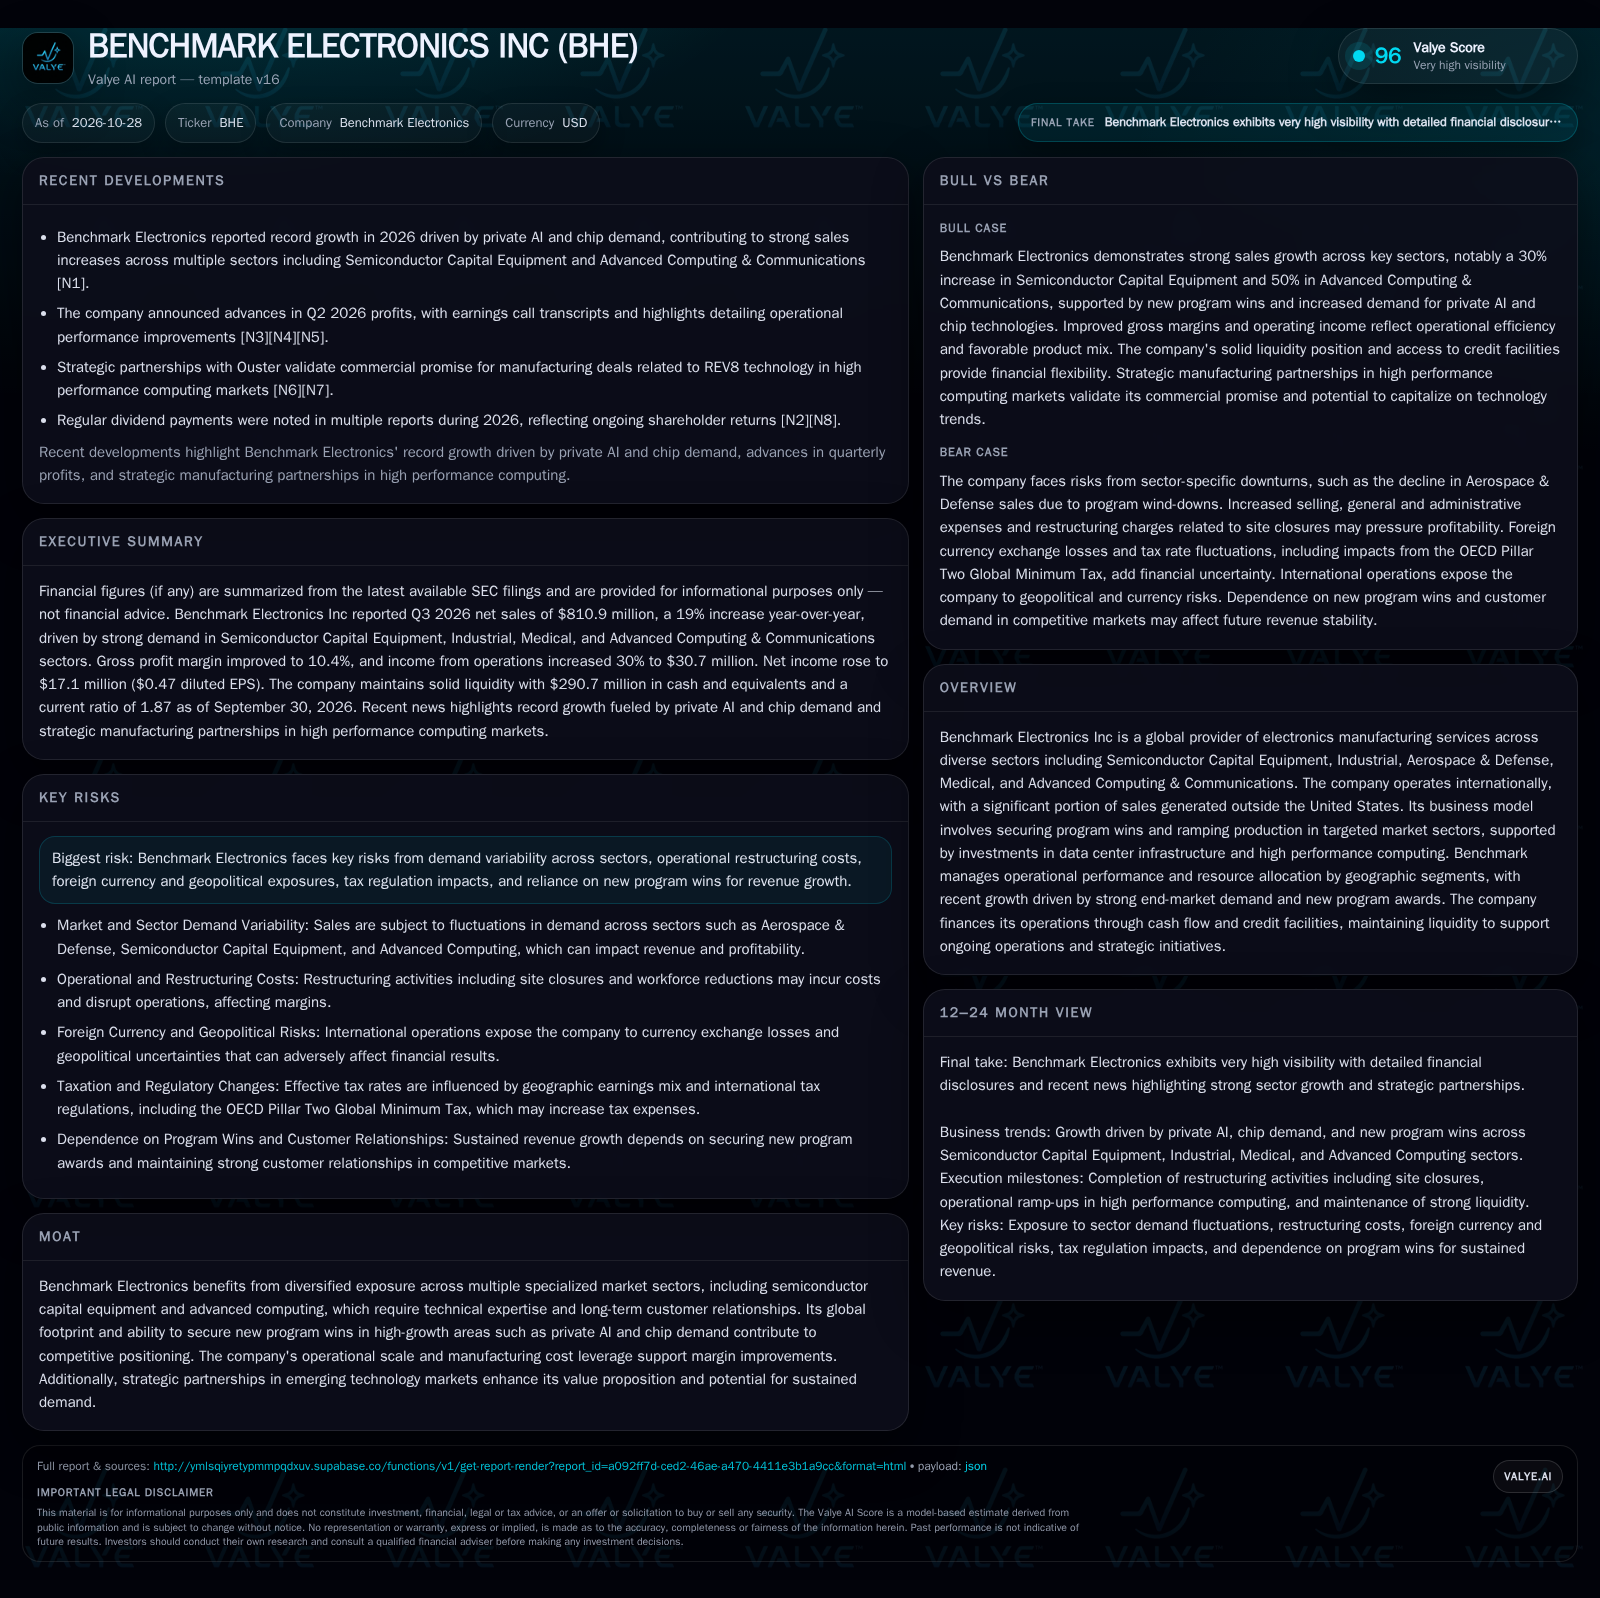
Benchmark Electronics delivered a 19% year-over-year sales increase in Q3 2026, led by demand for semiconductor and AI-related manufacturing. Gross margin improved to 10.4%, and operating income grew 30%. The company’s ability to secure new program wins in high-growth sectors is critical, but its model faces inherent volatility from program churn, restructuring costs, and exposure to foreign currency and tax headwinds. Strategic partnerships in high-performance computing validate commercial relevance, yet long-term stability will depend on sustaining sector momentum and managing global risks. [S2] [N1] [N7]
Benchmark Electronics’ 2026 performance underscores both the strength and inherent volatility of the diversified electronics manufacturing services model. With Q3 sales up 19%—driven by surging demand in semiconductors, advanced computing, and AI-related sectors—the company demonstrated its ability to capture growth from secular technology trends. Margin expansion and improved operational income point to effective cost leverage and favorable sector mix. [S2] [N1] [N7]
2026 Sales Surge and Margin Gains: What’s Driving the Numbers?
Benchmark Electronics reported Q3 2026 net sales of $810.9 million, a 19% increase compared to the same period in 2025. This growth was led by high demand and new program wins in Semiconductor Capital Equipment (+30% year-over-year), Advanced Computing & Communications (+50%), and solid performance in Industrial (+13%) and Medical (+9%). Aerospace & Defense was the only major segment to contract slightly, down 1% due to program wind-downs. [S2] [N1]
Gross margin climbed to 10.4% from 10.0% a year earlier, attributed to higher volume, manufacturing cost leverage, and a more favorable product mix. Operating income rose 30% to $30.7 million, with notable profit expansion in the Americas (+123%) and Asia (+17%)—demonstrating the impact of both scale and regional program mix. [S2]
International operations represented 66% of Q3 sales, with Americas up 20%, Asia up 22%, and Europe up 4%. The company reported a current ratio of 1.87 for the period. [S2]
Restructuring charges, primarily from the closure of the Phoenix, Arizona site and other capacity reductions, weighed on results but are expected to be substantially complete in 2026. [S2]
How Program Mix and Sector Exposure Shape Benchmark’s Economics
Benchmark’s revenue model is fundamentally program-driven: the company wins manufacturing mandates from customers in sectors such as semiconductors, advanced computing, industrial, medical, and aerospace & defense. These programs can be high-value and multi-year, but the business faces ongoing churn as legacy projects wind down and new ones ramp up. This dynamic creates both upside when secular trends align—such as the current surge in private AI and chip demand—and downside when segments like aerospace experience program attrition.
The company’s gross margin is sensitive to production volume, customer mix, and the complexity of manufacturing requirements. Higher-margin opportunities are typically found in advanced computing, semiconductor capital equipment, and specialized medical manufacturing—areas where technical complexity and regulatory requirements can create pricing power. Volume and operational leverage are key: as utilization rises, fixed costs are spread across more output, improving margins, as seen in the recent quarter.
Variable costs (materials, direct labor) remain high for contract manufacturers, limiting margin expansion unless the product mix shifts toward higher-complexity or higher-value projects. SG&A increased in 2026 due to variable compensation and stock-based pay, reflecting both growth and competitive labor markets. Ongoing restructuring generates near-term costs but may enhance long-term margin potential if underutilized capacity is eliminated.
Capital needs are moderate: the company funds operations through cash flow and maintains access to a $150 million term loan, a $550 million revolver, and a $45 million Malaysian facility, all maturing in 2030. This structure provides flexibility for working-capital swings, customer onboarding, and strategic investments. [S2]
Differentiation in a Crowded EMS Landscape: Where Could Benchmark Win?
Benchmark competes in the global electronics manufacturing services (EMS) market, a space characterized by intense price competition, customer churn, and the need for ongoing investment in process technology and quality systems. The company’s diversification across sectors—especially its presence in semiconductor capital equipment, advanced computing, and medical—helps reduce reliance on any single end-market and allows for cross-sector learning and capacity allocation.
Potential competitive advantages include technical expertise in highly regulated or complex sectors (such as medical and semiconductor equipment), a global manufacturing footprint, and the ability to rapidly scale production for new technology rollouts. Strategic partnerships, such as those in high-performance computing and data center infrastructure, may provide access to faster-growing niches and recurring program opportunities. [N1] [N7]
However, the EMS industry is structurally low-margin, and switching costs for customers are often limited unless Benchmark is deeply embedded in the customer’s design or supply chain processes. The real test of differentiation will be the company’s ability to secure sticky, higher-value programs in emerging technology verticals—particularly as AI, HPC, and specialized industrial applications demand tighter integration between design, engineering, and manufacturing.
Counterforces include competition from larger contract manufacturers with greater scale, price pressure from customers, and the risk of technology obsolescence or insourcing by OEMs. The company’s exposure to foreign currency and geopolitical risk, given its heavy international footprint, further complicates the competitive calculus.
Secular Tech Demand Fuels a New Cycle of Margin Expansion
If private AI, semiconductor capital equipment, and advanced computing demand remain robust, Benchmark could see sustained double-digit top-line growth as new program wins in these sectors offset churn elsewhere. The favorable product mix would support further gross margin expansion, especially if operational leverage continues and restructuring is completed as planned.
Strategic partnerships with technology leaders—such as manufacturing deals for high-performance computing infrastructure—could deepen customer relationships and create recurring, higher-margin business. [N1] [N7] Successful execution here may also result in Benchmark being selected as a preferred partner for next-generation chip or AI hardware launches, increasing visibility and backlog.
Confirmation of this scenario would include continued sequential revenue and margin growth in Semi-Cap and AC&C, new multi-year or multi-program awards in high-growth sectors, and evidence of improved retention or expansion within existing strategic customer accounts. Sustained international growth, especially in Asia, would further validate Benchmark’s competitive positioning.
Falsification would occur if sector growth stalls, if program churn accelerates (especially in high-margin areas), or if new partnerships fail to translate into material revenue or margin improvement.
Mixed Sector Trends and Margins Stabilize After Restructuring
The most plausible outcome is a continuation of solid—though likely moderating—growth, with sector rotation as some verticals (e.g., semiconductors, advanced computing) remain strong while others (e.g., aerospace & defense) stay flat or decline. Gross margin stabilizes in the low 10% range as operational leverage from volume gains is offset by wage and input cost inflation, and the benefits of recent restructuring are absorbed.
Program churn remains a feature of the business, with ongoing need for new awards to replace completed or lost contracts. The company maintains its global reach, but international sales growth slows as currency headwinds and geopolitical noise persist. SG&A and restructuring expenses normalize, but periodic charges reappear as capacity is realigned to demand.
Evidence for this scenario would be sequential revenue and margin stability, with periodic fluctuations by sector and geography, and no material deterioration in liquidity or credit access. Falsification would require a material revenue contraction in a core growth sector, unexpected loss of major programs, or a significant adverse regulatory/tax development impacting net income.
Program Churn, Cost Pressures, and Global Risks Converge
A negative outcome would be triggered by a combination of sector downturns (e.g., cyclicality in semiconductors, a pause in AI hardware investment, or further aerospace program wind-downs), loss of key program awards, and failure to replenish the pipeline with new business. This would result in declining revenue, underutilized capacity, and margin compression.
Restructuring costs could escalate if additional sites need to be closed or if demand fails to recover as expected. International operations could amplify risks: foreign currency losses, trade restrictions, or geopolitical instability may erode profits, while international tax changes (like the OECD Pillar Two Global Minimum Tax) could raise the effective tax rate and reduce net income.
Evidence supporting this scenario would include consecutive quarters of declining sales and margins, rising restructuring or impairment charges, sharp increases in SG&A not matched by revenue, or negative cash flow from operations. Falsification would require stabilization or rebound in at-risk segments and confirmation of new program wins that restore growth and margin trajectory.
Milestones That Will Shape Benchmark’s Next Phase
Sequential revenue and gross margin trends in Semiconductor Capital Equipment and Advanced Computing & Communications—sustained growth here would support the bullish case, while a reversal would challenge it. [S2]
Completion of restructuring activities, especially the Phoenix site closure—timing and cost versus plan will signal execution discipline and future margin potential. [S2]
Volume and margin performance in Americas and Asia segments—a useful metric would be segment-level operating income to test regional program mix and leverage. If disclosed.
Updates on new program wins or strategic manufacturing partnerships, particularly in AI, high-performance computing, and data center infrastructure—commercialization progress would help validate the growth thesis. [N1] [N7]
Trends in SG&A and restructuring charges—whether these normalize or remain elevated will impact profitability and scalability.
Foreign currency and effective tax rate impacts—quarterly disclosure will help assess the drag from international operations and new tax regimes. [S2]
Sector-specific customer concentration—if disclosed, changes in customer or program concentration would help assess revenue stability and risk.
Disclaimer: This is research-only, informational analysis and not investment advice. It may include AI-generated interpretation and general industry context. Always verify important details using primary sources.

Comments