
Blink Charging’s Struggle for Profitability Amid Network Expansion and Market Pressure
Blink Charging reports continued net losses in Q2 2026 while investing in scaling its EV charging network and improving utilization.
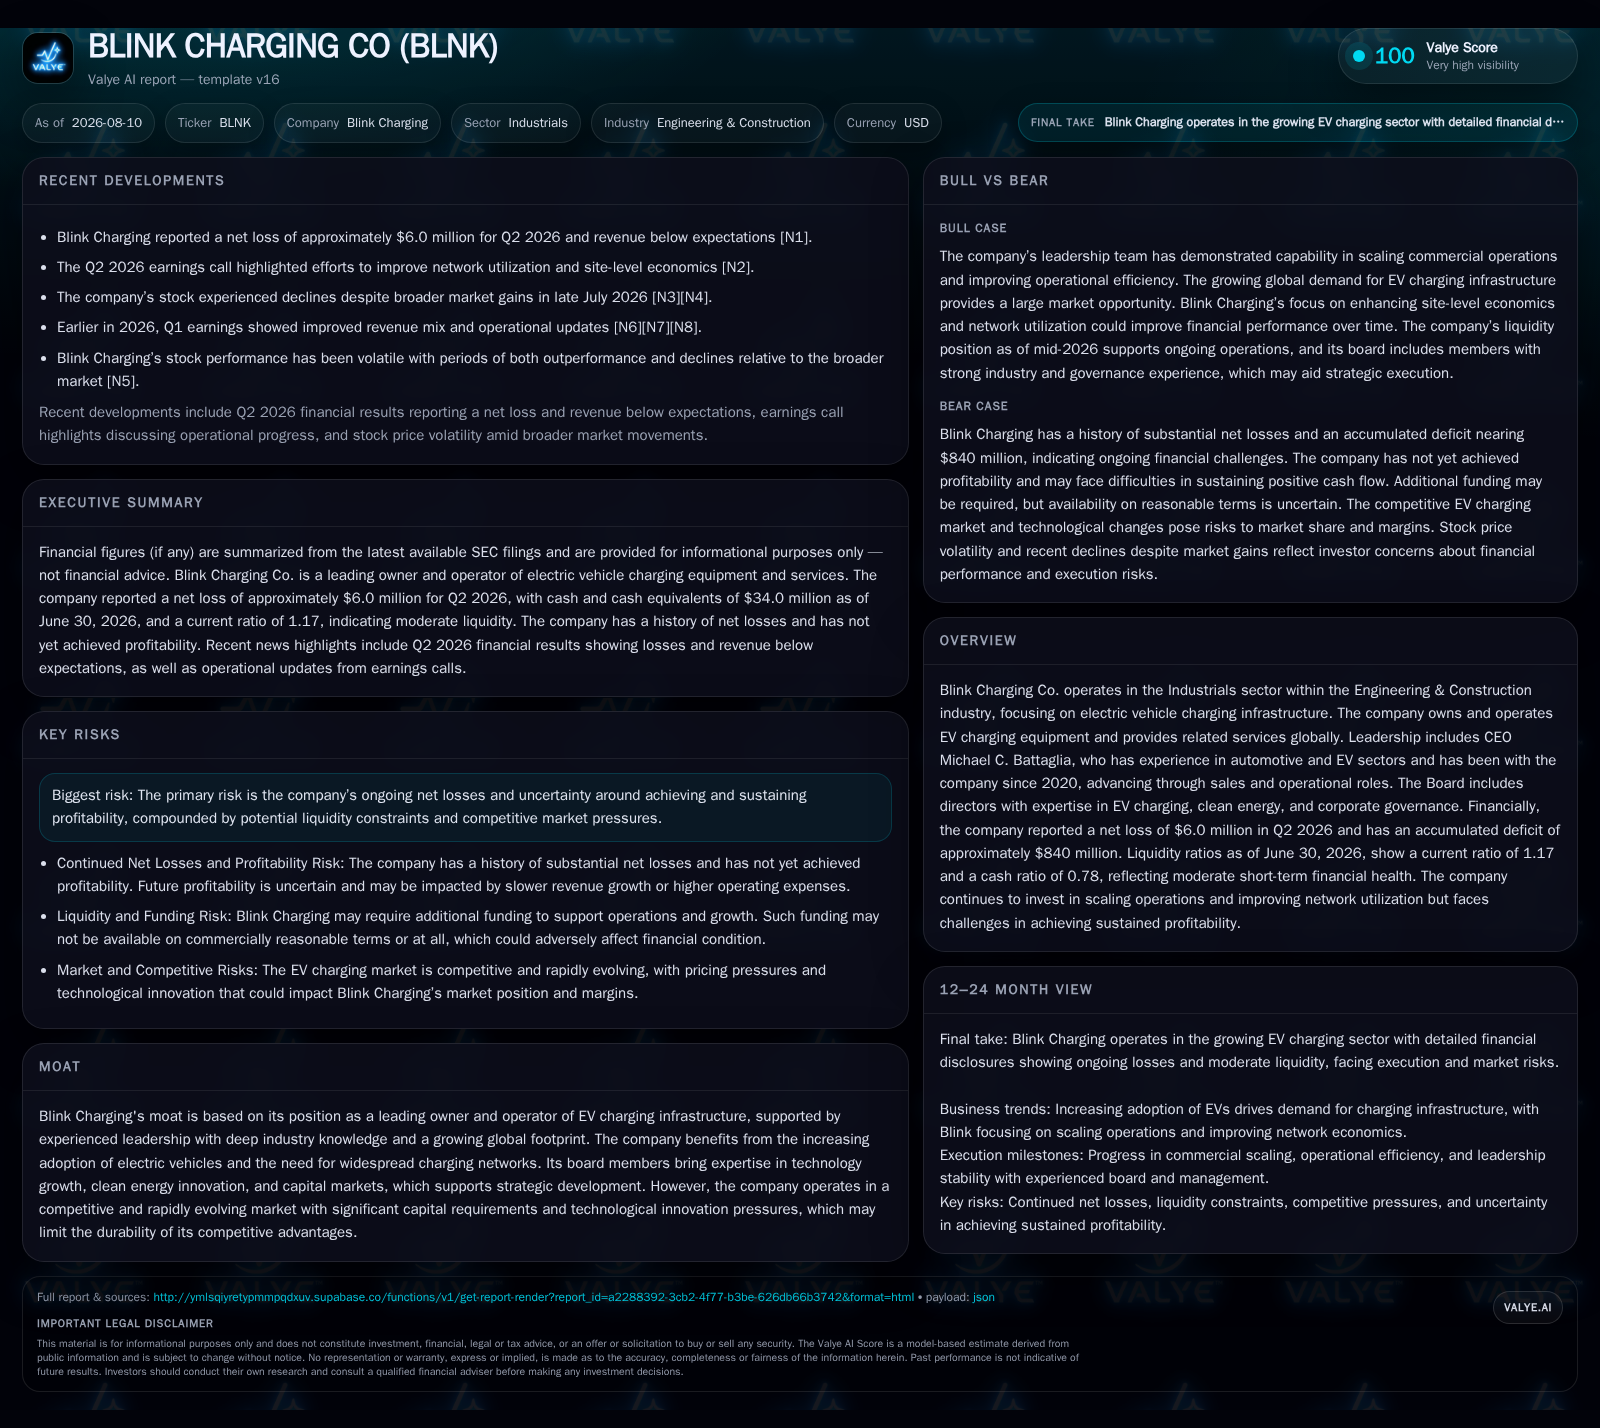
Blink Charging Co. remains entrenched in the capital-intensive electric vehicle (EV) charging infrastructure industry, reporting a net loss of approximately $6 million for Q2 2026 and an accumulated deficit near $840 million. Despite these losses, management emphasizes efforts to scale its global charging network and enhance utilization rates, key operational metrics tied to future profitability. The company grapples with high operating expenses related to network maintenance and competitive pressure from more established peers like ChargePoint and EVgo. Blink’s liquidity position appears moderate with a current ratio of 1.17 as of June 30, 2026, but achieving sustained profitability remains uncertain amid ongoing capital demands and pricing pressures.
Recent Operating Update: Continued Losses during Network Efforts
Blink Charging Co. reported a net loss of approximately $6 million in the second quarter ended June 30, 2026 [S2], [S3]. This continues the company’s trend of substantive quarterly deficits that have accumulated to an overall deficit near $840 million as of the end of Q2 2026 [S2]. These losses reflect the capital-intensive nature of building out and operating a global EV charging network — a business requiring substantial upfront investment in hardware installation followed by ongoing expenses related to network maintenance, customer acquisition, and platform operations.
Liquidity metrics show a current ratio of about 1.17 as of June 30, indicating moderate short-term financial health but without significant surplus liquidity [F1]. Cash & equivalents stood at roughly $34 million at quarter-end — a necessary buffer given anticipated operating cash burn [F1]. The modest total debt figure disclosed is negligible compared to cash on hand; thus Blink carries minimal leverage currently [F1], which could allow room for additional financing if needed.
CEO Michael C. Battaglia’s commentary points toward strategic emphasis on improving network utilization — measured as charging sessions per station — and enhancing site-level economics to shift the core unit economics closer to profitability over time [S1]. This operational focus recognizes that higher utilization improves revenue per deployed charger by spreading fixed costs over more sessions.
Business Model: Owner-Operator of EV Charging Infrastructure
Blink operates in the mid-to-late stages of the EV charging value chain as an owner and operator rather than solely as a hardware manufacturer or software provider. The company installs Level 2 chargers and DC fast chargers at various commercial sites through partnerships with site hosts such as retail locations or real estate owners. It monetizes its installed base primarily via usage fees charged per charging session plus recurring subscription-based services for network access or premium features.
Revenue drivers hinge on both expanding the number of deployed stations to grow addressable usage volume and increasing utilization rates at existing sites. Average revenue per session (ARPS) depends on pricing power balanced against competitors’ pricing in local markets. The company incurs significant operating expenses encompassing electricity costs (which fluctuate with energy prices), station maintenance to ensure uptime/reliability, customer support infrastructure, and capital expenditures for deploying new stations or upgrading existing ones.
The monetization mix advantage comes from owning the assets generating recurring cash flow rather than merely selling hardware outright; however, this model also requires continual reinvestment to maintain competitive technology standards amid fast-evolving charging speeds and interoperability demands.
Industry Structure and Competitive Position
Blink competes within a highly fragmented yet consolidating EV charging industry marked by aggressive expansion from incumbents such as ChargePoint Holdings — a peer recognized for extensive North American footprint — as well as EVgo focusing on fast DC charging corridors. Additionally, Tesla operates a proprietary Supercharger network serving its loyal user base with tightly integrated hardware-software synergies.
Unlike pure-play hardware manufacturers who sell chargers but not services, Blink’s owner/operator status positions it directly against these network operators in terms of market share defined by stations deployed and sessions served. However, Blink lacks the scale advantages held by larger operators who benefit from wider geographic presence enabling higher utilization rates through denser networks.
Utilities are increasingly entering this space too, leveraging existing customer relationships and grid management expertise to offer bundled charging solutions — adding further competition especially in regulated markets.
From a technology perspective, Blink must continuously invest to keep pace with advancements such as faster DC chargers that reduce session duration but often require higher CapEx outlays.
Growth Drivers: Electrification Tailwinds Coupled with Operational Execution
The fundamental growth driver is the accelerating global shift toward electric vehicles mandated by regulatory mandates on emissions reduction plus consumer demand fueled by improving EV driving ranges and cost competitiveness. This macro tailwind increases the need for accessible public chargers across urban centers, commercial premises, workplaces, and highway corridors.
Government incentives—both direct rebates for installing public chargers and indirect policies promoting EV adoption—bolster deployment economics industry-wide. Blink benefits from these favorable policy frameworks but remains sensitive to shifts that could alter subsidy levels or compliance requirements.
Partnerships with commercial real estate owners or retail chains represent another growth vector enabling rapid site acquisitions critical to scaling station numbers. Such partnerships also influence deployment lead times—a key KPI—where faster installations accelerate revenue ramp-up.
Improvements in network utilization directly boost profitability potential by lifting average revenue per deployed asset without commensurate rises in fixed costs. Blink’s strategy prioritizes increasing customer adoption patterns at existing sites alongside growing its footprint.
Technological innovation—such as integration with renewable energy sources or smart-grid capabilities—offers differentiation opportunities enhancing site-level economics potentially beyond simple charging fees.
Risks and Watchpoints: Path to Profitability Remains Uncertain
Blink's ongoing net losses underscore structural challenges faced across the EV charging operator segment related to cost structure rigidity versus revenue scale-up timelines [S2], [S16]. Achieving consistent profitable quarters is uncertain given potential slower-than-expected utilization improvements or upward surprises in operating expenses.
Capital intensity poses continuous funding requirements; although current debt levels are low [F1], future expansion may necessitate additional fundraising either through equity issuances diluting shareholders or debt which could impose financial covenants constraints.
Competitive pressures from larger networks maintaining superior scale advantages risk compressing pricing power or displacing Blink at desirable locations if stronger players secure exclusive host arrangements.
Technology obsolescence threats persist given rapid innovation cycles demanding costly upgrades to maintain customer satisfaction—a factor tightly linked to system uptime reliability KPIs.
Energy price volatility directly impacts variable costs tied to electricity consumption during charging sessions; adverse swings here can erode operating margins without timely pricing adjustments possible due to competitive dynamics.
Regulatory policy changes pose medium-term risks including possible alterations in subsidies or mandates influencing charger economics or investment priorities.
Securing partnerships with attractive site hosts remains challenging amid competition; delays here extend installation lead times constraining incremental revenue generation speed.
What to Watch Next: Utilization Metrics and Financial Trajectory
Monitoring Blink’s reported network utilization rates—charging sessions per station—will provide insight into execution effectiveness towards profitable unit economics [S1]. Increases here confirm progress leveraging installed assets better amidst fixed cost absorption challenges.
Tracking average revenue per session will signal whether pricing strategies sustain amidst competition or require concessions lowering margins.
Installation lead times will indicate how rapidly Blink can convert secured deployments into revenue-generating stations—a critical capacity metric given industry-wide urgency around infrastructure proliferation.
Financially, short-term indicators include quarterly net income trends alongside cash flow from operations revealing whether scaling investments translate into improving liquidity positions without excessive external funding dependence.
Additional signs include management updates on partnership wins with commercial site hosts or utilities expanding access channels beyond organic channel growth pathways.
Pay attention also to any adjustments in capital expenditure plans reflecting changes in deployment pace or technology upgrades needed due to competitive environment shifts.
Financial Profile Discussion
At June 30, 2026, Blink recorded approximately $71 million in current assets compared with roughly $61 million in current liabilities resulting in a current ratio near 1.17—indicating just enough liquid resources to cover near-term obligations without large buffers [F1]. Cash reserves stand at about $34 million providing operational runway amidst ongoing losses [F1]. Total debt is minimal at under half a million dollars although likely understated given historic data limitations; no recent filings indicate material borrowing suggesting reliance primarily on equity capital so far [F1].
The accumulated deficit approaching $840 million confirms longstanding unprofitability challenging Blink’s path towards positive earnings despite CEO Battles’ operational improvement initiatives focused on growing usable volume on deployed assets [S2]
Future financial milestones hinge upon attaining sustained positive gross margins driven by improved utilization rates combined with disciplined expense control addressing network maintenance efficiencies plus lower customer acquisition costs over time—critical levers shaping overall cash flow dynamics going forward.
This analysis is based strictly on publicly filed SEC documents dated through August 7, 2026, supplemented by industry knowledge regarding electric vehicle charging infrastructure markets. It does not constitute investment advice nor endorse any particular outcome relating to Blink Charging Co.'s securities or business performance.
Disclaimer: This is research-only, informational analysis and not investment advice. It may include AI-generated interpretation and general industry context. Always verify important details using primary sources.

Comments