
Blink Charging’s Crossroads: Scaling EV Infrastructure Amid Losses, Liquidity Constraints, and Intensifying Competition
The company’s ability to transition from hardware deployment to sustainable, high-utilization network economics will determine whether it can defend its position in a capital-intensive, rapidly evolving landscape.
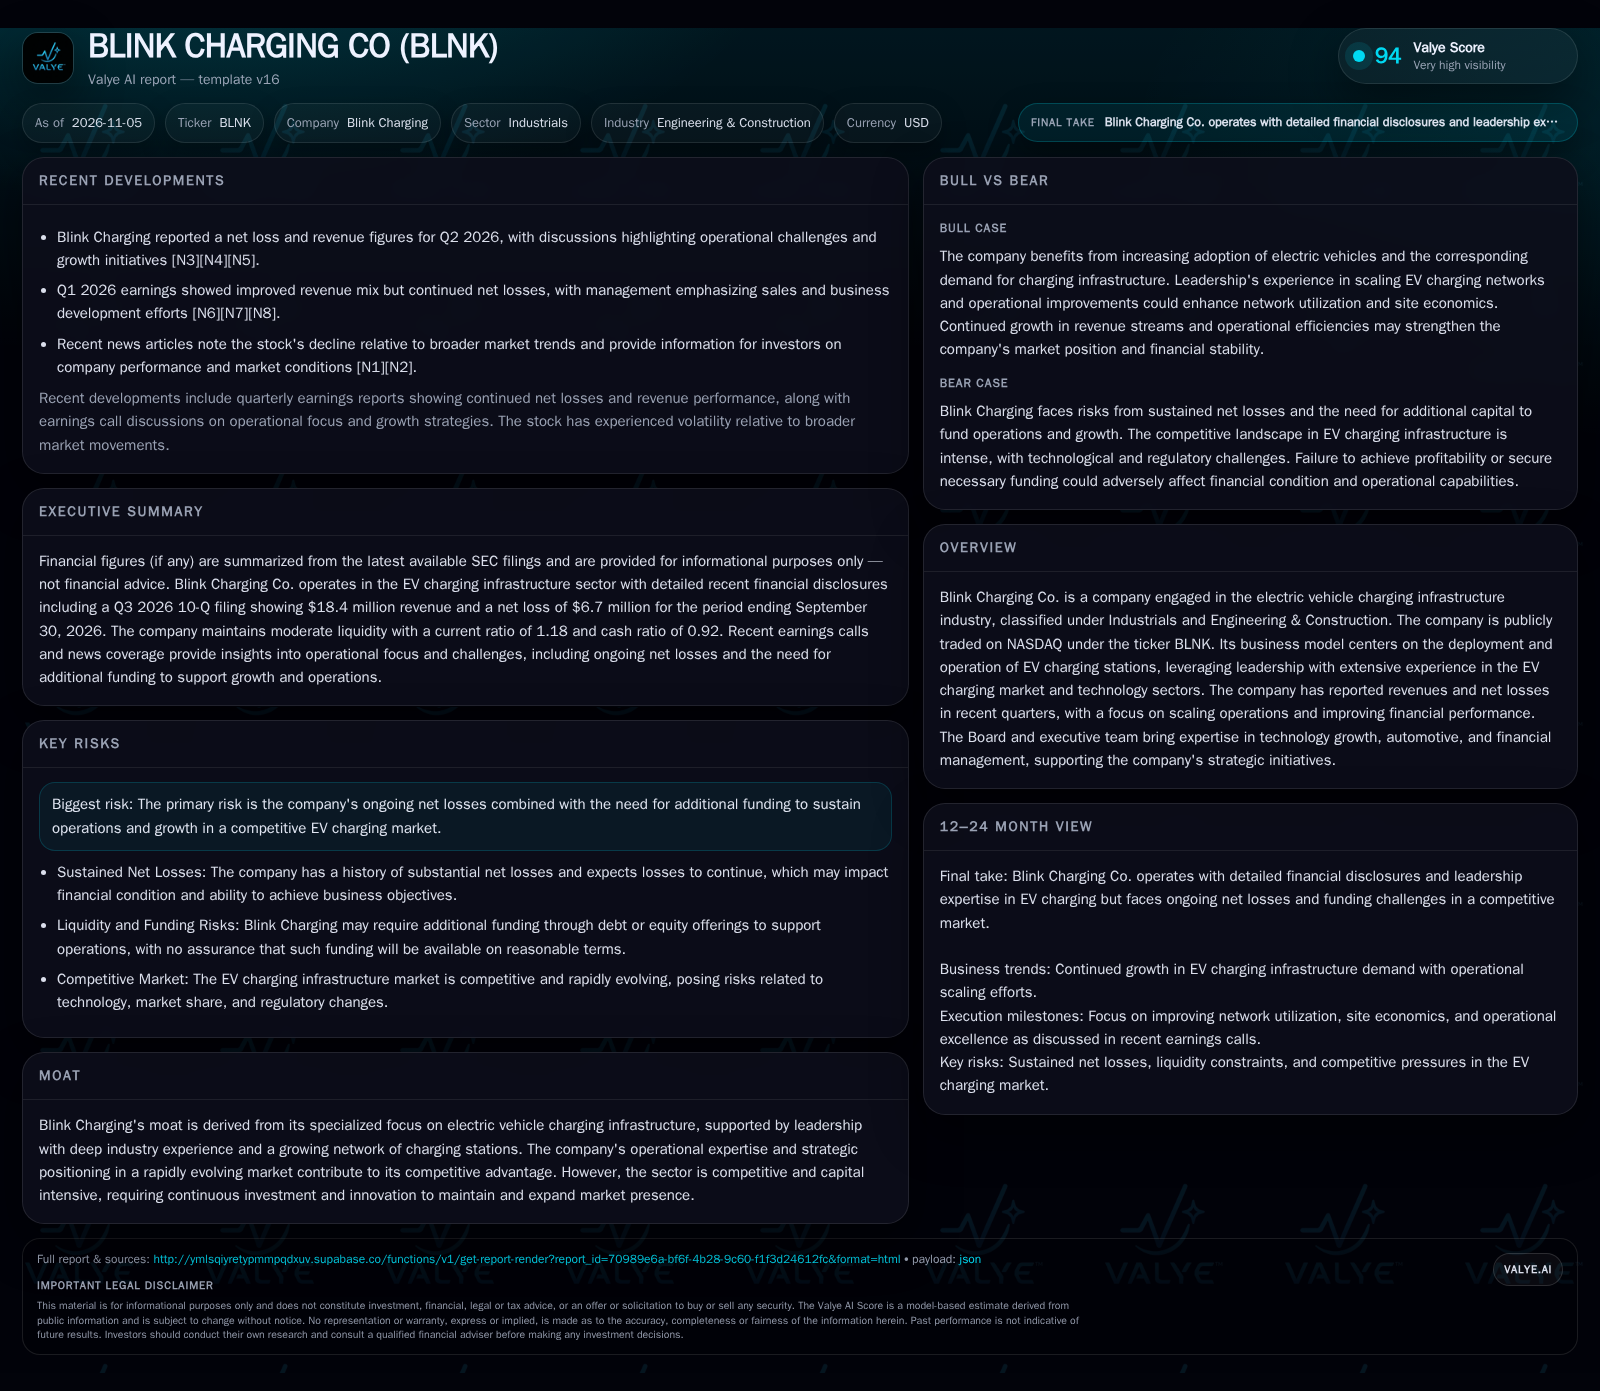
Blink Charging reported $18.4 million in revenue and a net loss of $6.7 million for the nine months ended September 30, 2026, maintaining reported liquidity position with a current ratio of 1.18 and cash ratio of 0.92. Persistent net losses and an $846.7 million accumulated deficit underscore the company’s ongoing need for additional funding. The leadership team focuses on improving network utilization and operational efficiency, but execution risks remain high in a competitive EV charging market. Blink’s prospects hinge on achieving profitable scale while managing funding, technology, and regulatory challenges. [S2] [N3] [N4] [N6]
Blink Charging stands at a critical inflection point: the company is expanding its electric vehicle charging network in a market poised for secular growth, yet it has not solved for profitability or capital self-sufficiency. Leadership’s operational focus has shifted to improving site-level economics and network utilization, but the competitive, capital-intensive nature of the EV charging industry means that sustained losses and the need for additional funding remain central risks. The next phase for Blink will be defined by its ability to drive utilization, manage costs, and secure the capital required to survive—and eventually thrive—in a crowded market. [S2] [N3] [N5] [N7]
Operating Losses and Liquidity Remain the Defining Features of Blink’s Financial State
As of September 30, 2026, Blink Charging reported revenue of $18.4 million and a net loss of $6.7 million for the nine-month period. The company’s balance sheet showed cash and cash equivalents of $30.5 million, current assets of $56.7 million, and current liabilities of $48.2 million, resulting in a current ratio of 1.18 and a cash ratio of 0.92. The company reported cash and liquidity metrics for the period; these figures do not by themselves establish operating runway, investment capacity, financial flexibility, or financing capacity. Management continues to cite risks related to sustained net losses and the uncertainty of securing new capital on favorable terms. [S2]
From Hardware Deployment to Network Economics: The Search for Profitable Scale
Blink Charging’s core business model is centered on deploying, owning, and operating EV charging stations. Revenue is typically generated through a mix of hardware sales, network usage fees, and potentially maintenance or software services. The capital-intensive nature of building out charging infrastructure requires significant upfront investment, while revenue accrues gradually as installed assets are utilized.
The company’s economics depend heavily on driving high utilization rates at installed charging sites. Low utilization depresses network-level margins, while fixed costs (including site leases, maintenance, and network operations) create operating leverage: higher throughput can dramatically improve profitability, but underutilization leads to persistent losses. Blink’s recent focus on site-level economics and operational excellence is a tacit acknowledgment that growth alone—measured by station count—does not guarantee sustainable margins.
Given the ongoing losses and the need for additional funding, Blink faces a classic chicken-and-egg dilemma: scaling the network requires capital, but the path to self-sustaining unit economics is not yet proven. The question is whether the company can reach the critical mass of high-utilization sites before external funding becomes constrained or dilutive.
Competitive Pressures and Substitution Risks in a Crowded EV Charging Landscape
Blink operates in a highly competitive sector characterized by rapid technological evolution, capital intensity, and a mix of public and private players. Competitor categories include vertically integrated charging networks, automotive OEM-backed charging alliances, utility-owned infrastructure, and newer entrants leveraging software-first or asset-light business models.
The primary sources of competitive advantage in this industry are network density and reliability, seamless user experience (including payment and interoperability), and the ability to secure prime real estate or site partnerships. Blink’s leadership brings experience in EV charging and technology, but the company lacks the scale and balance sheet strength of some major rivals. As the market matures, customer switching costs remain low—drivers can use multiple networks, and site hosts can select among providers based on economics and incentives.
Technology substitution risks are also present: advances in battery range, ultra-fast charging, or new business models (such as mobile charging or integrated home/workplace solutions) could erode the value of public charging networks. Blink’s competitive position will depend on its ability to build differentiated site economics and defend utilization in the face of both incumbent and disruptive threats.
Utilization Gains and Capital Access Could Unlock a Path to Sustainable Economics
The most favorable scenario for Blink involves a combination of accelerating EV adoption, improved network utilization, and continued access to capital. If the company succeeds in driving higher throughput at existing sites—through better locations, partnerships, or software-driven optimization—margins could inflect positively due to operating leverage.
Confirmation of this scenario would come from sustained increases in same-site revenue, rising network utilization rates (if disclosed), and a narrowing of net losses relative to revenue growth. Additional evidence would include successful capital raises on non-dilutive terms, new high-traffic site partnerships, or announcements of multi-year contracts with large fleet or real estate partners. Evidence against this scenario would be persistent stagnation in network usage or continued reliance on dilutive equity to fund operations.
Scaling Brings Growth, but Profitability Remains Distant Without a Structural Shift
The most plausible outcome over the next 12-24 months is that Blink continues to grow its installed base and revenue, but remains unprofitable as utilization and site economics lag the pace of network expansion. The company likely faces ongoing cash burn and periodic fundraising, with operational improvements only partially offsetting the sector’s fixed-cost burden.
Evidence that would falsify this scenario includes a clear inflection in network-level gross margins, a rapid reduction in cash burn, or a successful transition to a recurring, high-margin revenue mix.
Funding Constraints or Utilization Misses Could Trigger a Strategic Reset
The adverse scenario sees Blink unable to materially improve utilization or site economics, leading to ongoing losses and deteriorating liquidity. In a tightening capital environment, the company may struggle to raise funds on acceptable terms, forcing a slowdown in network expansion, asset sales, or even a strategic restructuring.
Confirmation of this downside would be flat or declining revenue, widening net losses, shrinking cash balances, and evidence of distressed capital raises or cost-cutting measures. Additional red flags would include loss of key site partnerships, asset impairments, or management turnover. Conversely, evidence against this scenario would be resilient liquidity, stable or improving operational metrics, and successful navigation of capital markets.
Milestones That Will Test Blink’s Transition from Growth to Viable Network Economics
Progress in network utilization rates (if disclosed), as a leading indicator of whether site-level economics are improving.
Trends in same-site revenue and gross margin, which would clarify whether existing assets are becoming more productive.
Net cash used in operations and the evolution of cash burn rate, as a measure of the company’s financial runway and operational discipline.
Announcements of new site partnerships with high-traffic hosts (e.g., retail, fleet, municipal), suggesting improved network density or strategic relationships.
Terms and frequency of new capital raises, including the mix of debt versus equity and the cost of capital secured.
Any evidence of recurring, contracted revenue streams (e.g., fleet contracts, service agreements) that could enhance revenue visibility.
Management commentary on progress toward profitability, including updates on operational excellence and cost control initiatives.
Changes in competitive landscape—such as new entrants, technological shifts, or regulatory developments—that could affect Blink’s market position.
Disclaimer: This is research-only, informational analysis and not investment advice. It may include AI-generated interpretation and general industry context. Always verify important details using primary sources.

Comments