
Cass Information Systems: Payment Ecosystem Leverage, Fee Dynamics, and the Stakes of Transaction Mix
Cass Information Systems leverages an integrated payment processing platform and a regulated bank subsidiary to serve large enterprises—yet faces a complex mix of volume, pricing, and regulatory pressures. Recent growth in dollar volumes and net interest income contrasts with declining transaction counts and fee compression, highlighting the importance of mix, scale, and operating discipline as competitive and macroeconomic forces intensify.
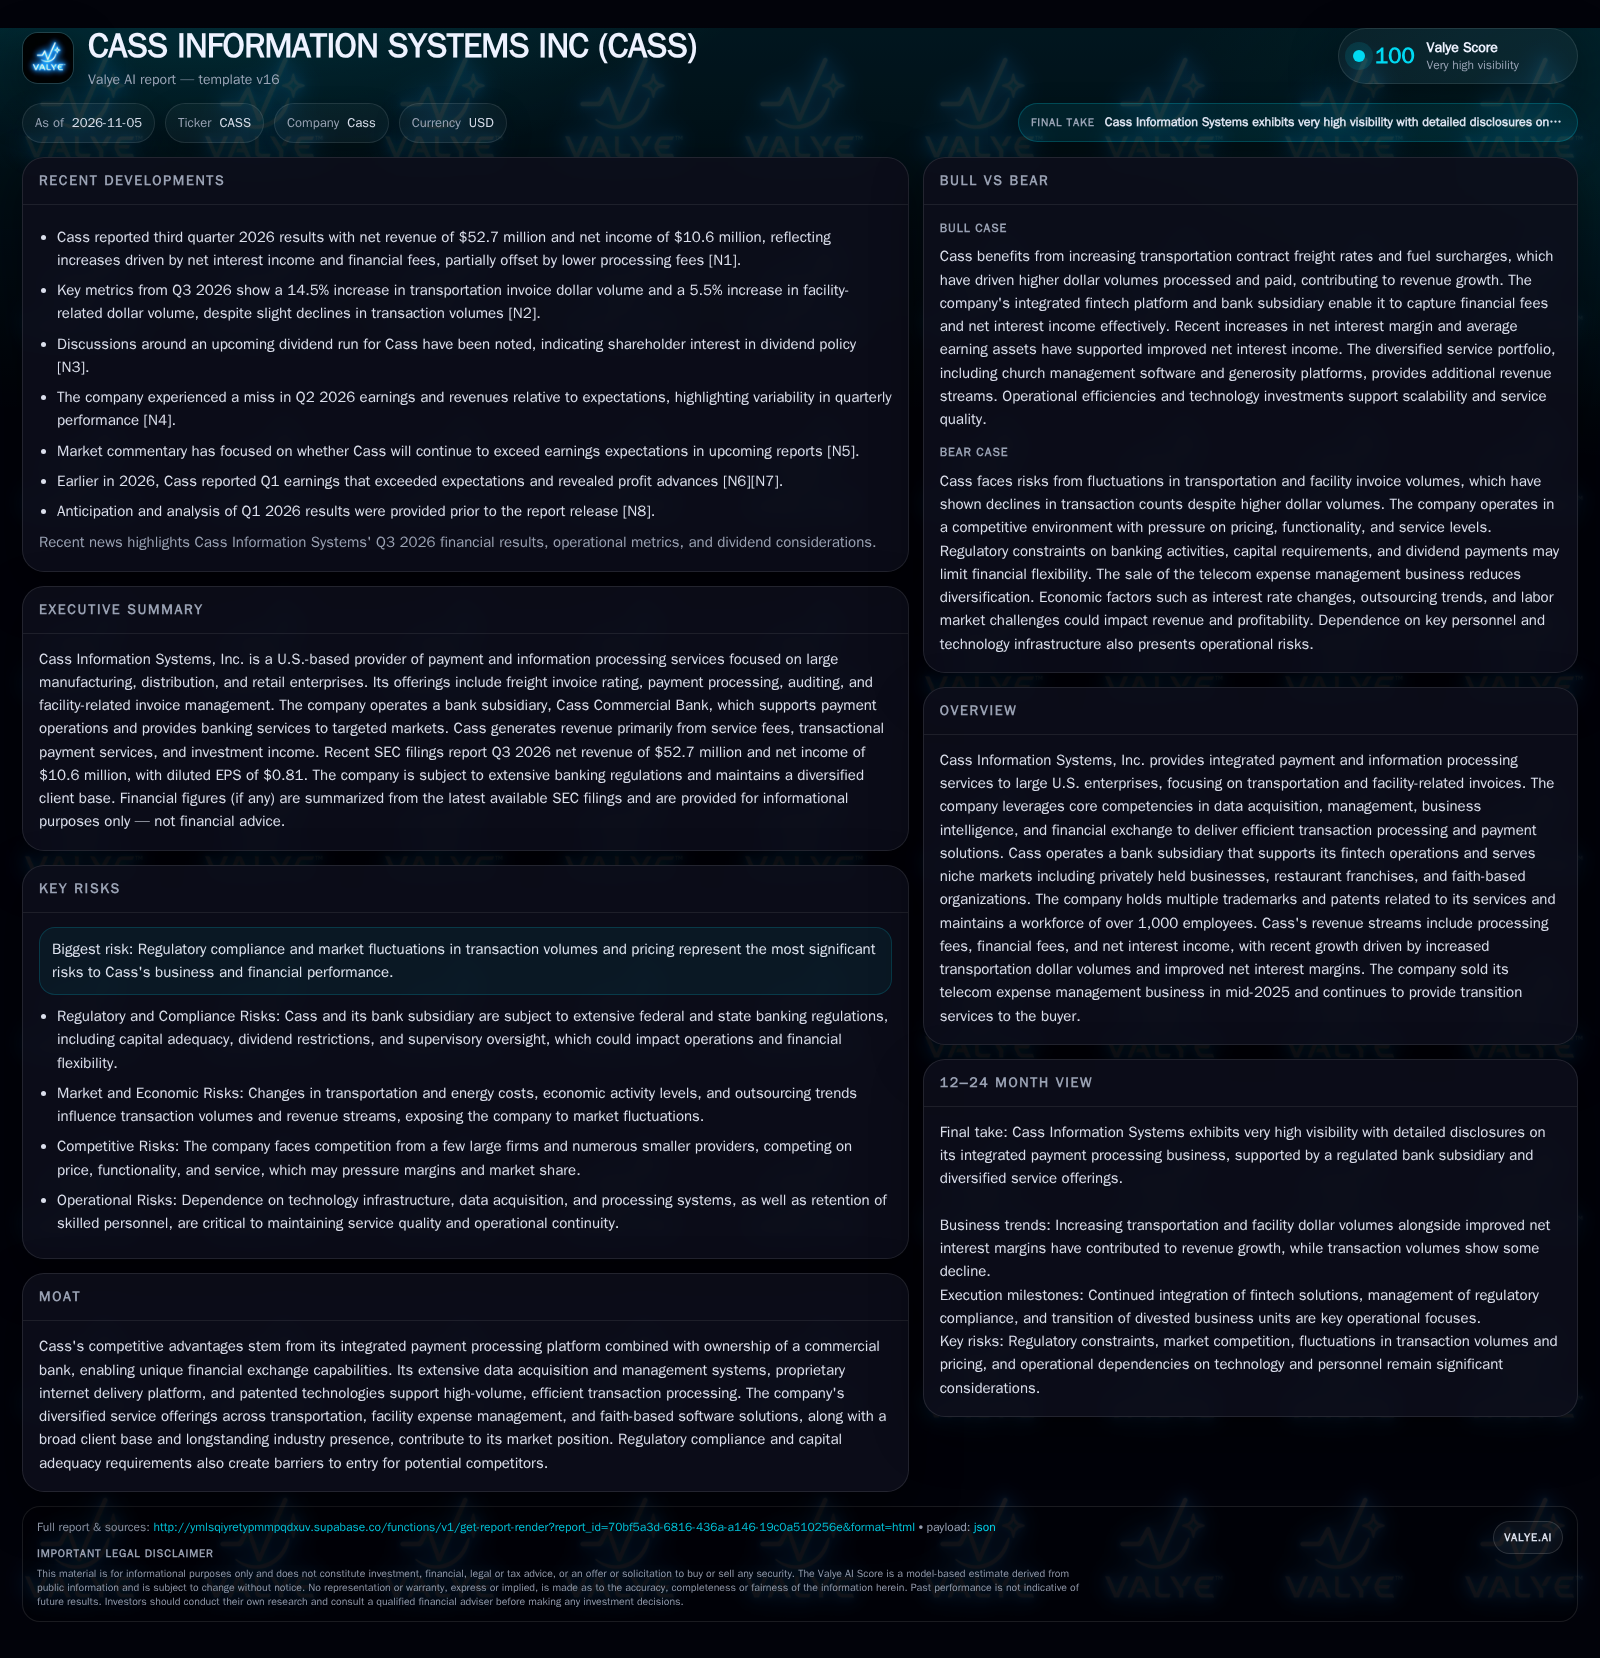
Cass Information Systems reported a strong increase in transportation and facility-related invoice dollar volumes in Q3 2026, even as transaction counts declined slightly and processing fees fell. Financial and other fee income rose, supported by higher payments in advance of funding and licensing gains. The company’s integrated fintech-plus-bank model drives both fee and interest income, but future performance will hinge on the interplay between transaction mix, regulatory constraints, and the ability to scale value-added services amid price competition and shifting client demand. [N2] [S2]
Cass Information Systems sits at the intersection of financial technology and regulated banking, processing billions in transportation and facility invoices for large U.S. enterprises. In Q3 2026, the company delivered robust growth in payment dollar volumes but saw a decline in transaction counts and processing fees, pointing to a nuanced shift in revenue drivers. As interest income and specialized software fees rise, Cass’s future will likely depend on its ability to optimize transaction mix, manage fee compression, and navigate the regulatory and competitive crosscurrents shaping the payment processing industry. [N2] [S2]
Recent Volume-Mix Shifts and Fee Trajectories: What’s Changed in Cass’s Core Metrics
In Q3 2026, Cass reported a 14.5% increase in transportation invoice dollar volume and a 5.5% rise in facility-related invoice dollar volume compared to the prior year. However, both business lines experienced slight declines in transaction counts (transportation down 1.2%; facility-related volumes also down modestly), indicating that average ticket sizes increased or that Cass processed fewer but larger invoices. Despite the dollar volume growth, processing fees fell 4.6%, highlighting either competitive fee pressure or a shift toward lower-margin transactions. Financial fees climbed 11.8%, driven by higher payments in advance of funding and increased interchange activity on CassPay, while other fees—particularly from church management software licensing—rose 18.7%. Net interest income increased 8.9%, with net interest margin improving to 4.02% as average earning assets grew 4.8% to $2.29 billion. These dynamics underscore a business model in transition, where revenue growth increasingly comes from financial fees and interest income rather than pure payment processing. [S2] [N2]
Dissecting Cass’s Revenue Engine: Mix, Margin, and the Leverage of Scale
Cass’s core economics hinge on a blend of transaction-based processing fees, financial fees linked to payments and float, software licensing, and net interest income from its bank subsidiary. The recent divergence between rising dollar volumes and falling transaction counts suggests that average invoice values are climbing, which may boost float and financial fee opportunities but does not guarantee higher fee revenue if pricing per transaction is under pressure. Processing fees, typically a function of transaction count and complexity, are susceptible to both competitive price compression and adverse mix shifts toward larger, negotiated accounts. Financial fees benefit from higher payment volumes processed in advance and from interchange on the CassPay platform—both of which can scale as clients consolidate spend. The bank subsidiary provides Cass with access to low-cost deposits (notably, a 15.3% increase in average noninterest bearing demand deposits), which can be deployed into loans and investment securities for net interest margin. However, average loans declined 1.8% while securities holdings rose 14.7%, indicating a portfolio tilt toward lower-risk, lower-yield assets. Operating leverage is a function of technology investment, regulatory compliance, and the capacity to scale platform services without proportional cost increases; recent expense growth may reflect ongoing investment but could weigh on margins if fee compression persists. [S2]
Cass’s Moat: Integrated Platform Scale vs. Price and Functionality Pressure
Cass’s competitive position is defined by its scale in U.S. transportation and utility invoice processing, proprietary technology, and ownership of a regulated bank. These features enable Cass to offer bundled payment, data, and banking solutions to large enterprises, differentiating it from pure-play processors or banks without integrated platforms. The company faces competition from a small group of national peers and a long tail of smaller providers, with pricing, service level, and platform functionality as key battlegrounds. While Cass’s bank subsidiary supports unique financial exchange capabilities and the ability to monetize payment float, competitors can potentially erode fee margins by offering lower-cost, feature-rich alternatives or leveraging new fintech architectures. The company’s position in utility information processing is further strengthened by its independence from energy service providers and its data management IP. However, the 2025 sale of the telecom expense management business reduces diversification and may leave Cass more exposed to core segment volatility. Regulatory compliance and capital requirements serve as barriers to entry, but also limit Cass’s flexibility relative to less regulated fintech challengers.
How Cass Could Unlock Further Value: Scaling Specialized Fees and Deepening Platform Integration
A favorable trajectory for Cass would involve continued growth in high-value payment volumes, successful cross-selling of CassPay and church management software, and further expansion of float-driven financial fees. If the company can deepen relationships with large enterprise clients—encouraging them to consolidate more spend through Cass’s platform—processing volumes and average invoice values could rise, supporting both fee and net interest income. Additional upside could come from leveraging proprietary data and analytics to introduce new, higher-margin business intelligence or automation services. Confirmation would come from a sustained uptrend in financial/other fees outpacing declines in processing fees, improvement in operating leverage (flat or declining expense growth relative to revenue), and evidence of new client wins or expanded wallet share in existing accounts. A step-up in software licensing and recurring platform revenues would further validate this scenario. Conversely, stagnation in fee growth or persistent margin pressure would challenge the thesis.
Mix Management Amid Margin Pressure: A Realistic Outlook for Cass
The most plausible path for Cass involves ongoing growth in payment dollar volumes—driven by large enterprise clients and inflationary increases in underlying costs—but continued volatility in transaction counts and pressure on processing fees. Financial and other fee income (from CassPay and faith-based software) will become a larger proportion of revenue, partially offsetting traditional fee compression. Net interest income will likely remain robust as long as Cass maintains strong deposit inflows and a healthy net interest margin, but the declining loan book and a shift toward lower-yield securities could cap upside. Operating expenses may rise with ongoing technology and compliance investments, limiting margin expansion unless revenue growth accelerates meaningfully. Confirmation would be a steady mix of fee and interest income growth, stable or improving returns on assets and equity, and evidence that new product lines (e.g., church management software) are gaining traction. Falsification would be persistent declines in processing and financial fees, material erosion of transaction volumes, or outsized increases in operating costs.
Margin Compression and Volume Erosion: The Adverse Chain for Cass
A negative scenario could unfold if competitive pricing pressure accelerates, pushing processing fees down faster than Cass can offset with financial and software fee growth. If transaction counts continue to decline—either due to client losses, insourcing, or broader economic weakness—then both fee and interest income could stagnate or contract, particularly if average invoice values plateau or fall. Regulatory changes or adverse audit outcomes could further constrain bank subsidiary operations or increase compliance costs, eroding profitability. In this scenario, operating expenses outpace revenue growth, and Cass is unable to generate sufficient new business in specialized verticals to compensate. Evidence for this downside would include consecutive quarters of declining total fee revenue, shrinking deposit or loan balances, and a deterioration in returns on equity and assets.
Testing the Cass Thesis: Fee Dynamics, Client Volume, and Platform Expansion
Quarterly trends in processing, financial, and other fees—especially the pace at which Cass can grow non-transactional revenues.
Transportation and facility invoice dollar and transaction volumes, to determine whether mix shifts are sustainable and supportive of revenue.
Average invoice size and client concentration, if disclosed, to assess exposure to large accounts and pricing leverage.
Growth in CassPay deposits and usage metrics, indicating adoption and competitive traction for the B2B payment platform.
Performance of the church management software solution—specifically licensing fee growth and new customer acquisition.
Net interest margin and average earning asset trends, tracking the sustainability of interest income contributions.
Operating expense growth versus revenue growth, as a proxy for operating leverage and efficiency.
Updates on regulatory or compliance developments that could alter capital requirements, dividend capacity, or business model flexibility.
Disclaimer: This is research-only, informational analysis and not investment advice. It may include AI-generated interpretation and general industry context. Always verify important details using primary sources.

Comments