
Cedar Realty Trust Focuses on Portfolio Streamlining and Preferred Stock Repurchases to Stabilize Retail Income
Q1 2026 results reveal strategic asset dispositions, leasing progress, and capital management driving financial resilience.
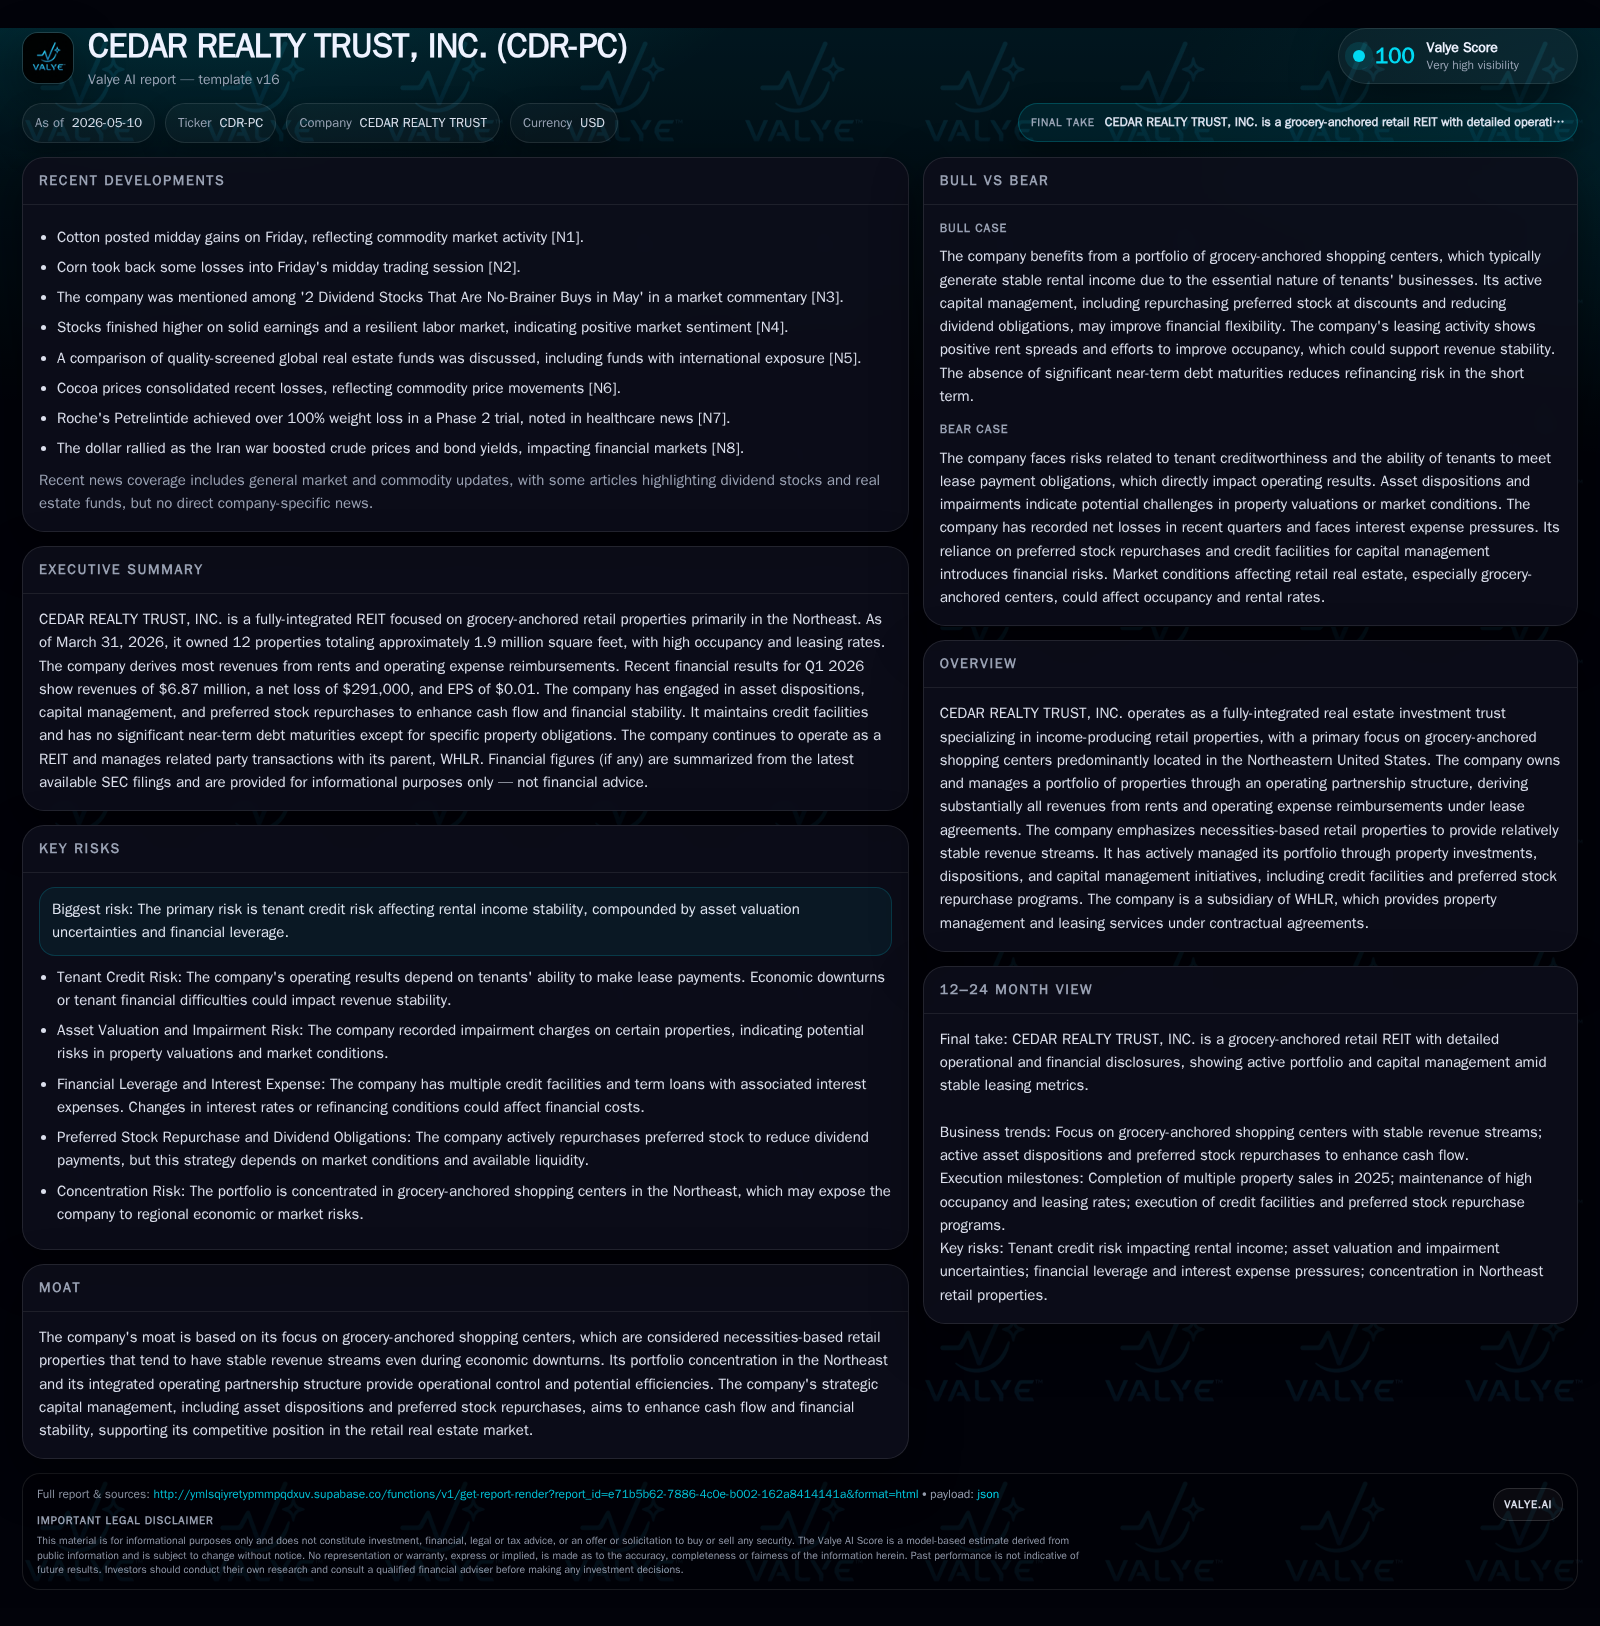
In its 10-Q filing for Q1 2026, Cedar Realty Trust reported a maintained portfolio of 12 grocery-anchored shopping centers concentrated in the Northeast with same-property NOI growth of 5.8% YoY, despite the reduction in aggregate rentable area from recent asset sales. The company continues to reduce preferred stock liabilities by repurchasing shares that trade below liquidation value, intending to enhance cash flow and offset the income lost from property dispositions. Leasing activity is focused on renewals with rate increases and selective new leases at above-market rents, supporting stable occupancy near 93%. While tenant credit risk and portfolio downsizing remain constraints, Cedar’s integrated operating structure under WHLR offers operational efficiency, with capital redeployment central to its growth strategy.
Recent Operating Update — Q1 2026 Results
Cedar Realty Trust’s May 8, 2026 Form 10-Q reports continued portfolio streamlining with ownership of 12 retail properties aggregating nearly two million square feet, down from 14 properties one year earlier due to recent dispositions across late-2024 and throughout 2025 [S2], [S14]. Despite shrinking asset count and leasable area (down ~310,000 sq ft), the company achieved a same-property net operating income (NOI) increase of 5.8% year-over-year for Q1 ended March 31, reflecting rent escalations and stronger expense recoveries [S19].
Leasing highlights show a concentrated effort on lease renewals with rental rates increasing substantially — renewal rent spreads averaged +27.3%, albeit on approximately only 6,400 square feet renewed during the quarter versus ~74,400 sq ft in Q1 last year [S19]. New leasing was lighter but commanded attractive average rents near $14.85/sq ft, reflecting selective credit tenant targeting amidst broader retail market churn.
Notably, Cedar repurchased another tranche of its Series C Preferred Stock (294,000 shares) during this quarter as part of a multi-year program initiated in August 2025 aimed at reducing preferred dividend obligations given preferred shares trading below liquidation values [S2], [S6]. Since early 2024 these repurchases have cumulatively decreased future annual dividend payments by about $6.1 million [S2]. Capital for these buybacks has been sourced through asset sales proceeds combined with bridge loans and credit facilities secured by properties slated for disposition or already sold [S2], [S5].
Business Model Overview
Cedar Realty Trust operates as an internally-managed REIT specializing in grocery-anchored shopping centers located primarily in the Northeastern United States [S1]. These “necessities-based” retail centers anchor stable tenant demand cycles centered around essential consumer goods outlets such as supermarkets.
The company owns its real estate mostly through an umbrella partnership structure—its Operating Partnership—where it holds full ownership and operational control. Revenues are primarily derived from contractual lease payments that include base rent plus reimbursement of property operating expenses [S1], creating a relatively predictable cash flow profile linked closely with tenant performance.
Property management, leasing services, and certain administrative functions are outsourced under contract to Wheeler Real Estate Company (WHLR), the parent company that exercises operational oversight [S2], [S24]. Management fees approximate a fixed percentage of gross operating income (about 4%), while leasing commissions apply per transaction contingent on third-party brokerage involvement.
The firm selectively reinvests capital in existing properties while strategically pursuing dispositions to optimize portfolio composition or monetize value accrued through earlier investments [S1]. It targets long-term asset quality and stable income generation rather than speculative development or aggressive expansion.
Industry Structure and Competitive Position
Operating within the grocery-anchored retail segment situates Cedar in a niche business model prized for resilience relative to more discretionary retail property types susceptible to economic cycles or e-commerce disruption. Grocery anchors generate consistent foot traffic supporting smaller tenants within the shopping center ecosystem.
Portfolio concentration in the Northeast emphasizes market familiarity but imposes geographic concentration risk. However, this regional focus enables Cedar to leverage localized knowledge for tenant retention and tailored property upkeep strategies amid competitive malls.
Cedar's competitive edge derives from its fully integrated operating partnership model under WHLR’s stewardship that consolidates property ownership with professional management services—an arrangement promoting synergies in leasing execution, cost controls, and capital deployment flexibility relative to externally managed peers.
Selected new leases signed command higher rents ($14.85/sq ft), signaling tenant willingness to pay premium rents where location fundamentals support it.
Portfolio Optimization
Further dispositions remain a lever for releasing capital tied up in non-strategic properties or those facing structural headwinds. Proceeds partly fund reinvestment into stabilized assets or debt repayment efforts enhancing financial flexibility [S2], [S5].
Capital Structure Efficiency
Aggressive retirement of discount-trading preferred shares directly reduces dividend obligations by over $6 million annually since program inception; this improves distributable cash flow available either for reinvestment or shareholder returns [S6], [S20]. Access to targeted credit lines with flexible drawdowns supports liquidity needs while allowing opportunistic financing aligned with repurchase activity.
Parent Company Support
Subsidiary status under WHLR grants access to sophisticated property management expertise plus streamlined cost structures benefiting from scale economies not typical for smaller standalone REITs.
Risks and Constraints
Tenant Credit Risk
Revenue stability hinges on tenants’ ability to meet lease obligations amid retail sector volatility; concentrated presence in grocery-anchored centers moderates but does not eliminate this vulnerability.
Portfolio Concentration & Asset Dispositions
Shrinking portfolio size following disposals diminishes income base initially; sustained earnings depend on backfilling vacancies promptly and successful repositioning of retained assets.
Financial Leverage Dependence
Outstanding debt nearing $143 million net of cash [$142.8M gross debt minus ~$5.6M cash] constrains financial flexibility especially if interest rates rise or refinancing options tighten [F1], [S2]. Maintaining covenant compliance while executing on repurchase programs requires prudent liquidity management.
Market Conditions for Retail Real Estate
Broader macroeconomic pressures including inflation, consumer spending shifts, or changing retail formats could impact demand across Cedar’s property types reducing lease renewals or pushing down achievable rents.
What to Watch Next
- Continued pace and pricing dynamics in preferred stock repurchases impacting dividend burden savings.
- Leasing velocity: renewal volumes vs new tenant acquisition uptake as key drivers for occupancy/stability.
- Further asset sales announcements—timing and pricing—to understand portfolio reshaping trajectory.
- Any modifications/renewal terms pertaining to credit facilities critical for short-to-medium term liquidity outlook.
- Monitoring tenant credit quality trends especially anchor grocers amid evolving competitive landscapes.
- WHLR’s operational support extent including management fee evolution relative to gross operating income trends.
- Quarterly updates on same-property NOI growth sustaining above inflationary pressures critical for long-term profitability insights.
Financial Profile Snapshot (Q1 Ended March 31, 2026) [F1], [S2]
Latest financial snapshot
| Metric | Value | Period |
|---|---|---|
| Cash & equivalents | $5.6 million | |
| 2026-03-31 | ||
| Total debt | $142.8 million | |
| 2026-03-31 | ||
| Net debt | $137.2 million | |
| 2026-03-31 |
Source: SEC companyfacts cache [F1].
While the company maintains leverage typical for retail REITs focused on grocery-anchored properties, ongoing repurchase programs aim at enhancing earnings quality by reducing dividend cash outflows related to preferred equity securities that historically traded at substantial discounts versus liquidation values.
This analysis reflects information as presented in SEC filings dated May 8, 2026 (10-Q), March 5, 2026 (10-K), May 8, 2026 (8-K), company facts as of March 31, 2026 extract, supplemented by public disclosures up to May 10, 2026.
Disclaimer: This is research-only, informational analysis and not investment advice. It may include AI-generated interpretation and general industry context. Always verify important details using primary sources.
Comments