
Crescent Energy: Eagle Ford Expansion, Capital Demands, and the Stakes of Integration in a Volatile Oil Market
Crescent Energy’s aggressive expansion in the Eagle Ford basin through a major acquisition and public equity raise highlights both its ambitions and its exposure to commodity price swings, capital intensity, and operational integration risks. The coming quarters will test whether scale and technical execution can overcome liquidity pressures and sector headwinds.
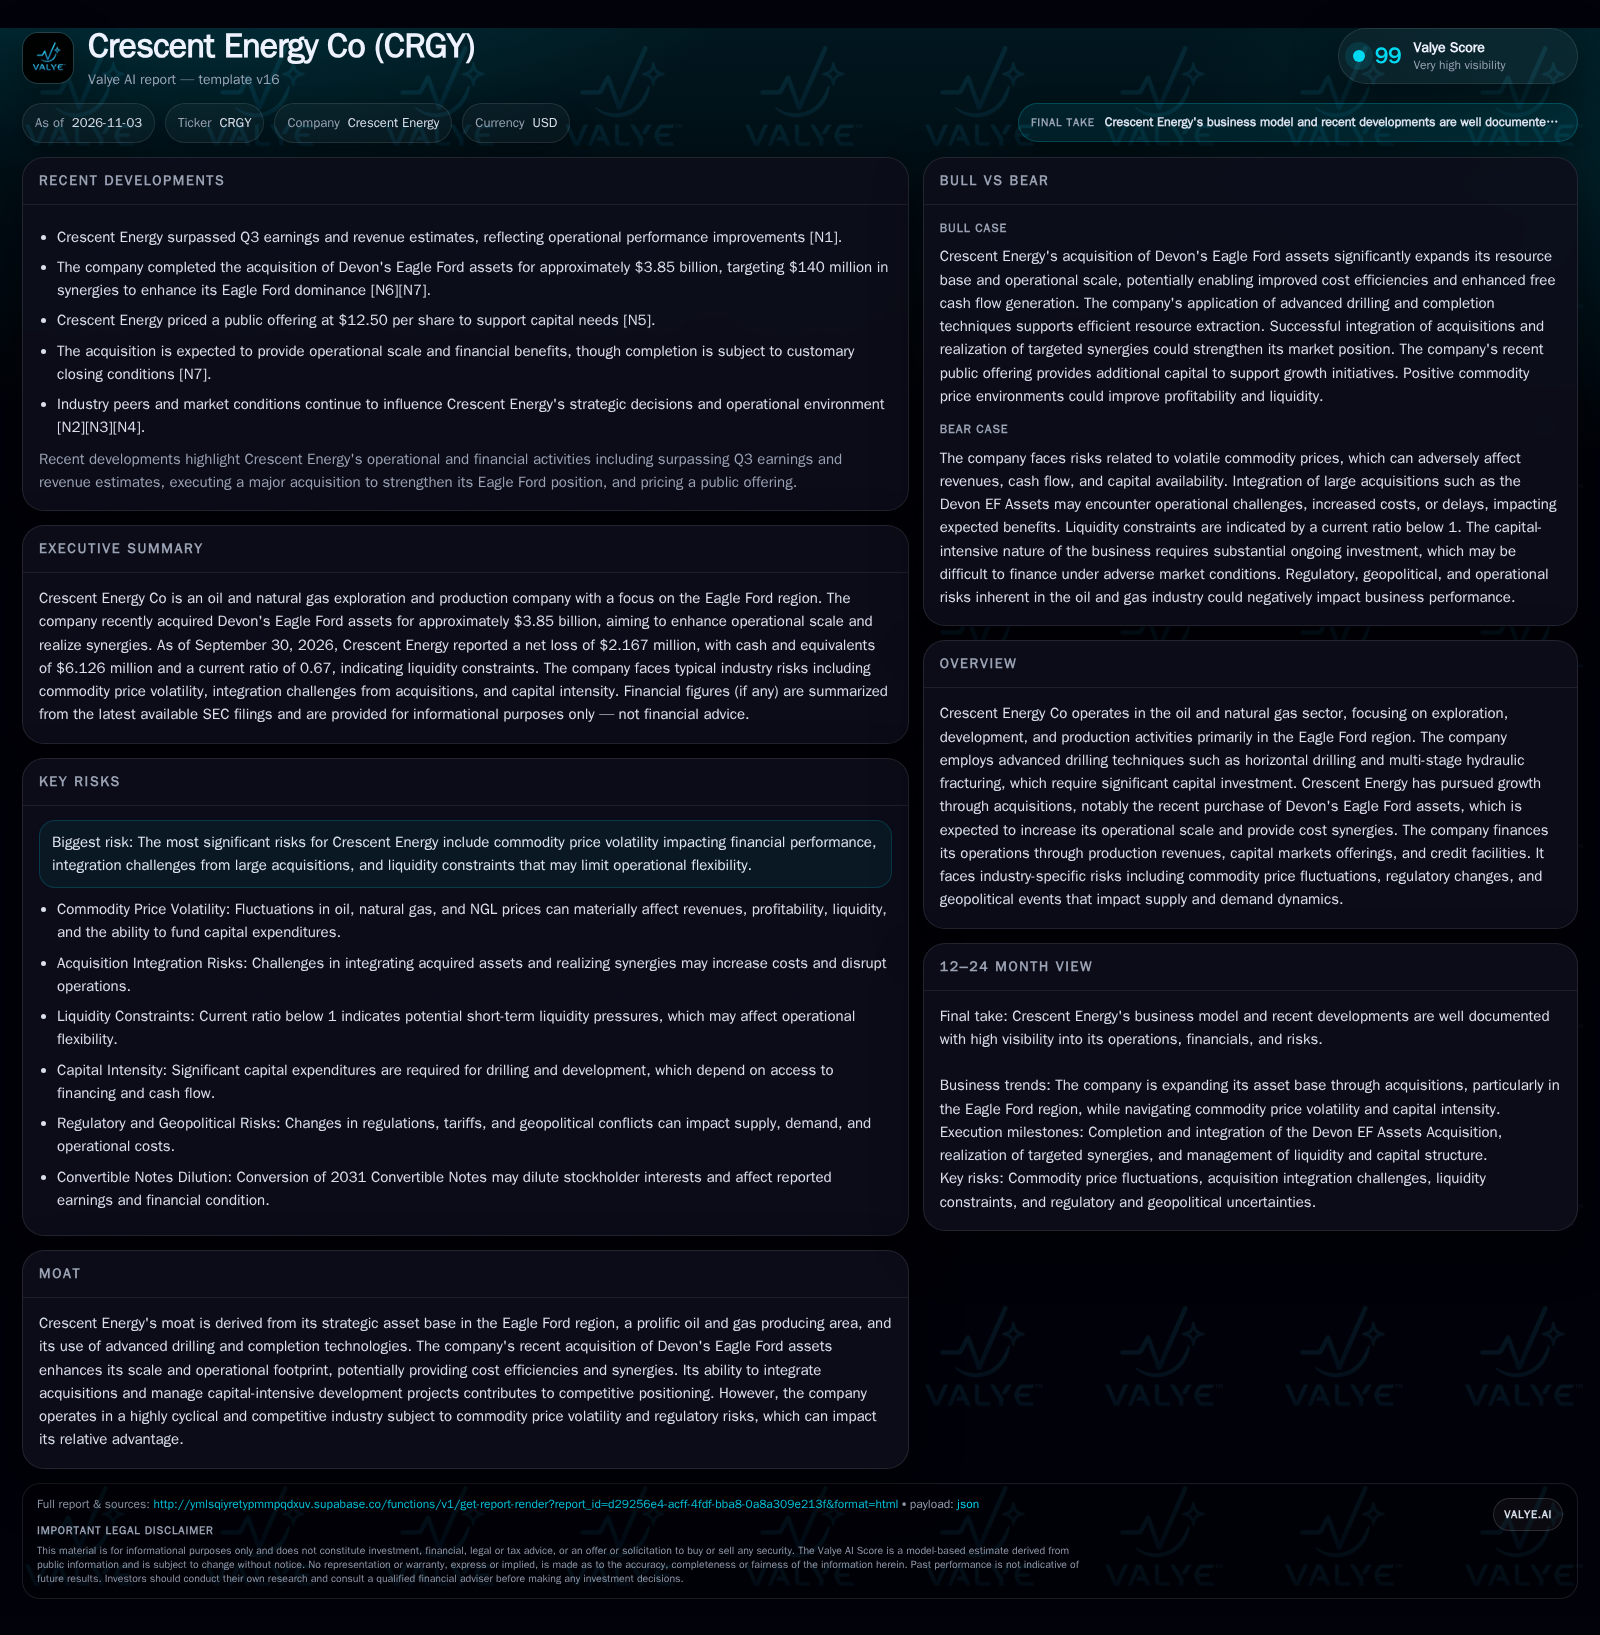
Crescent Energy has deepened its Eagle Ford footprint with a $3.85 billion asset purchase and targeted $140 million in synergies, funded in part by a $12.50/share public offering. Its future will hinge on successful integration, commodity price trends, and the ability to realize cost and operational efficiencies in a highly cyclical, capital-intensive market. [N1] [N5] [N7] [S2]
Crescent Energy’s latest moves—acquiring Devon’s Eagle Ford assets for $3.85 billion and raising fresh equity—have positioned the company as a larger, more influential operator in a prolific U.S. oil region. The answers will depend on commodity price trends, operational execution, and the company’s ability to manage both its financial structure and the shifting energy landscape. [N1] [N5] [N7] [S2]
Recent Acquisition and Capital Raise Reshape Crescent’s Risk-Reward Profile
The acquisition of Devon’s Eagle Ford assets for $3.85 billion marks Crescent Energy’s most significant expansion to date, with management targeting $140 million in annual synergies to drive operational efficiency and cost savings. This deal, completed in late 2026, materially increases Crescent’s exposure to the Eagle Ford—a region known for prolific oil and gas production but also for high capital requirements and operational complexity. [N7]
To help finance this expansion and maintain operational flexibility, Crescent completed a public offering at $12.50 per share in October 2026, providing an infusion of equity capital. [N5]
Despite these strategic moves, Crescent reported a net loss of $2.167 million for Q3 2026, with cash and cash equivalents of $6.126 million and a current ratio of 0.67 as of September 30, 2026. This liquidity snapshot signals near-term financial pressure and the need for disciplined capital management as the company absorbs new assets and works to realize promised synergies. [S2]
Q3 earnings and revenue exceeded analyst estimates, suggesting operational improvements, but the underlying financials highlight the delicate balance between growth ambitions and liquidity constraints. [N1]
Capital Intensity and Operating Leverage Define the Crescent Energy Model
Crescent Energy’s economics are fundamentally tied to the exploration, development, and production of oil, natural gas, and NGLs, with a heavy reliance on horizontal drilling and multi-stage hydraulic fracturing. These techniques can unlock significant reserves but are capital-intensive, requiring continuous investment in drilling, completion, and infrastructure to sustain or grow production volumes.
Revenue is closely linked to realized commodity prices, which are inherently volatile and subject to global supply-demand dynamics, geopolitical developments, and regulatory changes.
The company’s recent acquisition increases fixed costs (through asset depreciation, employee integration, and overhead) but also raises potential operating leverage if Crescent can drive substantial production volume and cost synergies. The targeted $140 million in annual synergies, if achieved, could lower unit production costs and improve margins, but integration risk and execution challenges remain significant.
To fund operations and growth, Crescent depends on a mix of operating cash flow, capital market access (as evidenced by the recent equity raise), and credit facilities.
Asset Scale, Technology, and Integration Drive Relative Advantage—But Headwinds Persist
Crescent’s core advantage lies in its concentrated Eagle Ford asset base, which offers scale, proximity synergies, and the opportunity to apply advanced drilling and completion technologies. The region is attractive for its established infrastructure, resource quality, and relatively low break-even costs compared to less mature basins.
However, the U.S. oil and gas sector remains highly competitive and cyclical, with peers ranging from large integrated majors to nimble independents. Many competitors have similarly adopted horizontal drilling and multi-stage fracking, eroding technical differentiation over time.
Crescent’s ability to integrate new assets efficiently and realize targeted synergies will partly determine whether it can achieve meaningfully lower cost structures or operational advantages. Failure to execute on integration or to control capital intensity could erode these potential gains.
Commodity price volatility and regulatory uncertainty further undermine any temporary cost or scale advantage, as even the most efficient operators can see profitability evaporate in downturns. The company’s capital structure—including convertible notes maturing in 2031—adds another layer of complexity, as future equity dilution and balance sheet management will influence competitive positioning.
Synergy Realization and Favorable Commodity Prices Unlock Margin Expansion
If Crescent successfully integrates the Devon Eagle Ford assets, rapidly achieves the targeted $140 million in annual synergies, and benefits from a supportive oil price environment, the company could see a step-change in free cash flow and margins. Production volumes would rise while unit costs decline, improving operating leverage and enabling more efficient capital deployment.
Additional upside could materialize if Crescent leverages its larger Eagle Ford footprint to negotiate better service contracts, optimize logistics, or deploy technology to further reduce drilling and completion costs.
Confirmation of this scenario would come from quarterly disclosures showing realized synergies hitting or exceeding targets, sustained increases in production volumes, improved per-barrel margins, and positive free cash flow after capital expenditures—even in the face of moderate commodity price swings.
Evidence that would falsify this scenario includes missed synergy targets, flat or declining production, persistent negative free cash flow, or inability to reduce operating costs despite increased scale.
Integration Progress Offsets Volatility, but Liquidity Remains a Constraint
The most plausible outcome over the next 12-24 months is that Crescent achieves partial but not full synergy realization from the Devon acquisition, with operational improvements helping to offset commodity price volatility but not fully resolving underlying liquidity pressures.
Equity dilution from the convertible notes and the recent public offering may weigh on earnings per share.
A deviation from this scenario would be signaled by either rapid synergy capture and margin expansion (upside) or integration setbacks, unexpected cost overruns, or further deterioration in liquidity metrics (downside).
Integration Setbacks and Price Declines Compound Liquidity Stress
If commodity prices decline meaningfully and/or Crescent encounters significant integration challenges—such as higher-than-expected costs, delays in operational alignment, or underperformance of acquired assets—the company could experience worsening cash flow and liquidity stress.
Confirmation of this downside would include missed production and synergy targets, negative operating cash flow, increased reliance on short-term borrowing, or disclosures of asset impairments and restructuring charges.
A less adverse outcome would require stabilization of commodity prices, successful mitigation of integration risks, and preservation of access to capital markets or credit facilities.
Milestones and Metrics That Will Reveal Crescent Energy’s Operational and Financial Trajectory
Quarterly synergy realization versus the $140 million annual target—progress here would directly validate or challenge the acquisition thesis.
Aggregate production volumes and per-barrel operating costs in the Eagle Ford region—if disclosed, these will show whether scale is translating into efficiency gains.
Commodity price sensitivity and realized price disclosures—tracking Crescent’s realized oil and gas prices versus benchmarks helps assess exposure to market swings.
Integration milestones, such as system and personnel consolidation, and any reported delays or cost overruns.
Updates on the potential conversion or refinancing of the 2031 Convertible Notes, and resulting impacts on dilution or potential financial flexibility.
Any regulatory, permitting, or geopolitical developments affecting Eagle Ford operations, as these could alter the risk/reward calculus.
Disclaimer: This is research-only, informational analysis and not investment advice. It may include AI-generated interpretation and general industry context. Always verify important details using primary sources.

Comments