
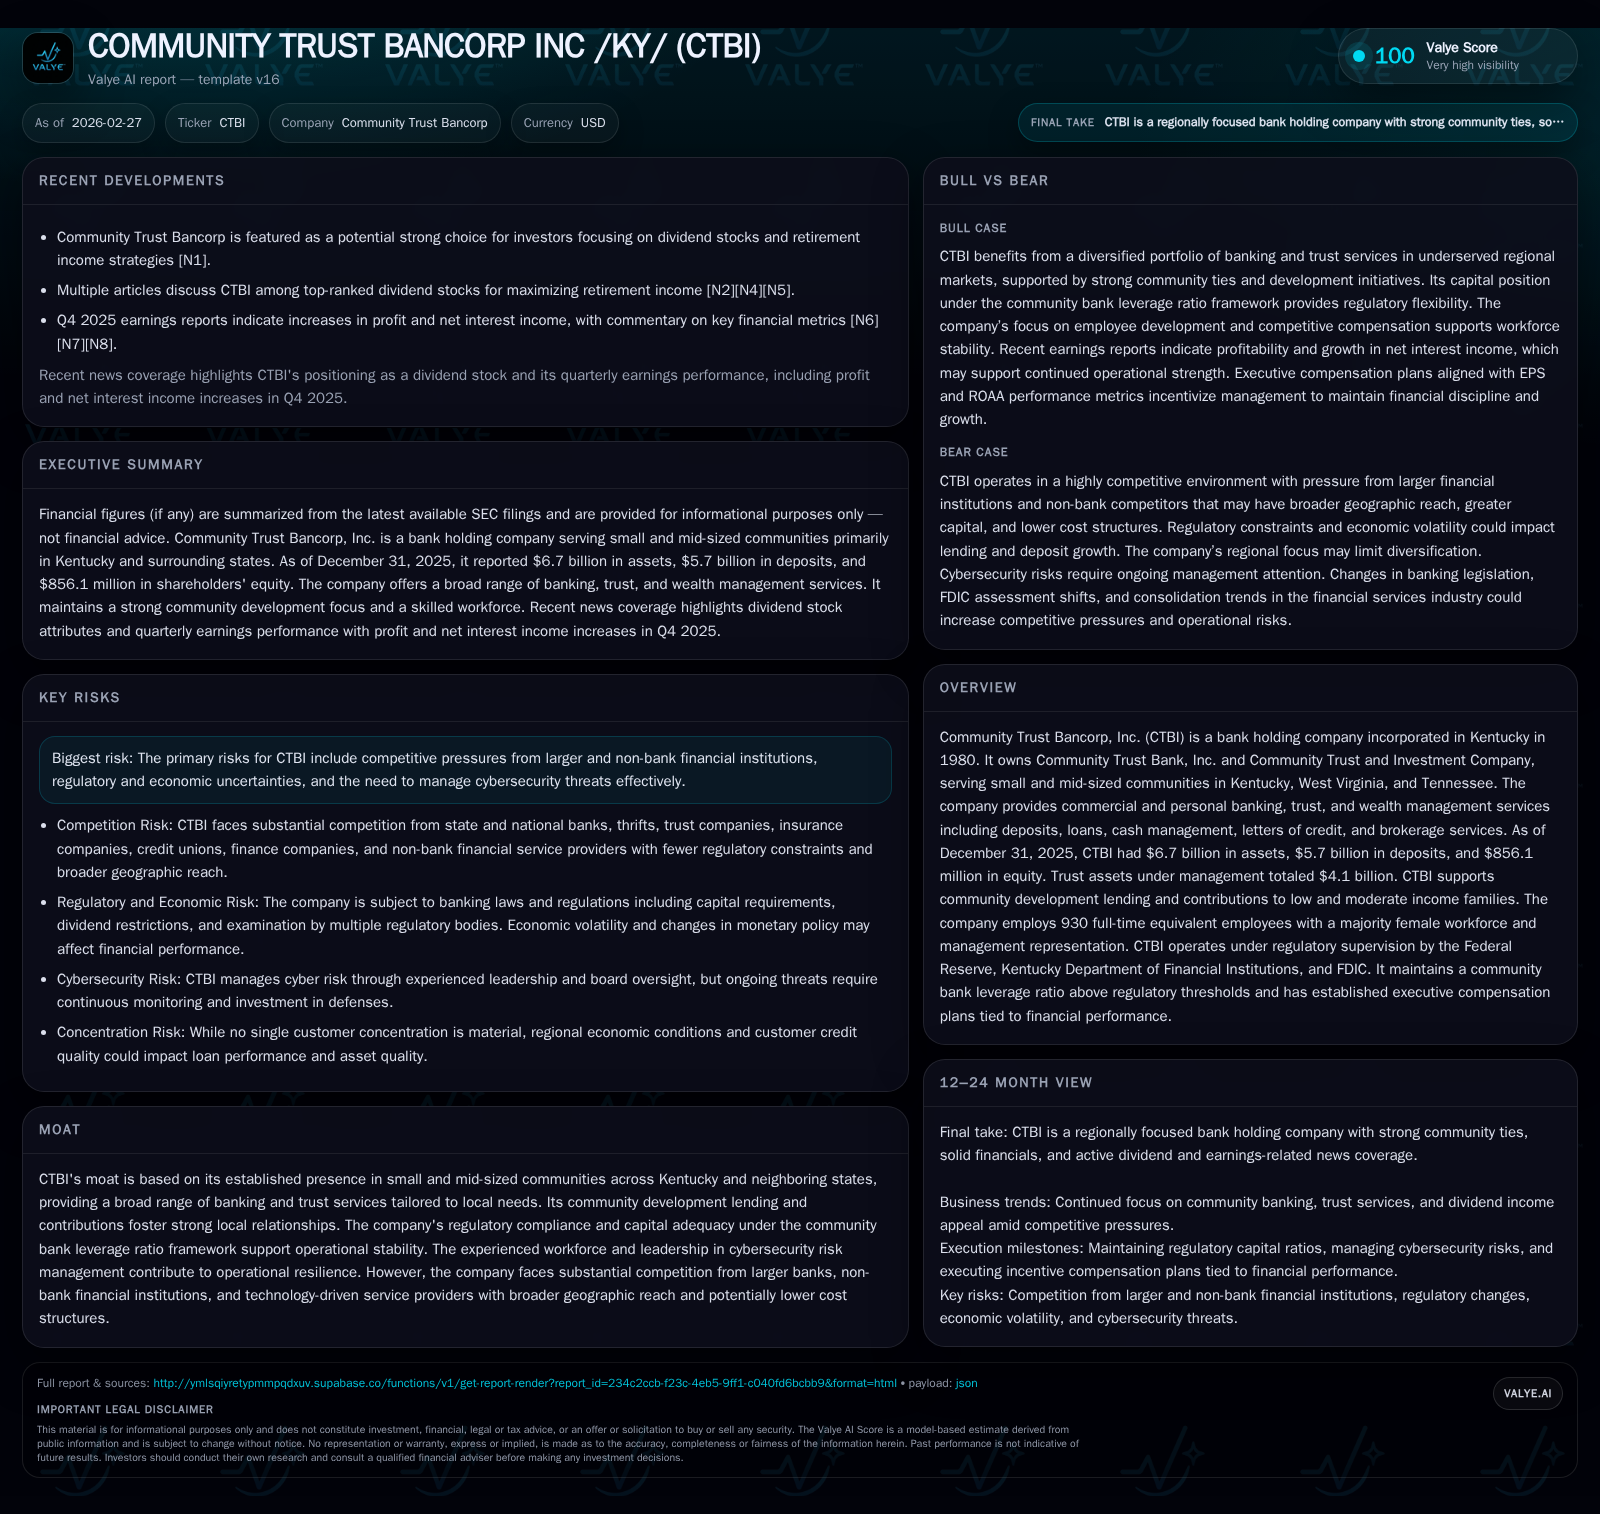
Community Trust Bancorp’s Steady Ascent: From Local Roots to Capital Strength
CTBI combines deep community engagement in its core regional markets with disciplined financial management, positioning itself to sustain stable growth amid intensifying competition.
Community Trust Bancorp, Inc. (CTBI) has demonstrated consistent profitability growth supported by robust operating cash flows and a conservative capital structure. Its strength lies in serving small and mid-sized communities across Kentucky, West Virginia, and Tennessee with tailored commercial banking and trust services, underpinned by committed local relationships and a predominantly female workforce. Going forward, CTBI faces competitive pressures from larger banks and fintechs that demand strategic investments in technology and service differentiation. Meanwhile, its prudent capital allocation prioritizes steady dividends over share repurchases, reflecting a cautious approach to balancing growth opportunities with regulatory and market uncertainties.
Historical Growth and Financial Drivers: Consistent Earnings From a Community Bank
Community Trust Bancorp (CTBI) has delivered steady financial progress over recent years anchored in its traditional community banking model focused on small to mid-sized markets in Appalachia. The company reported net income of $98.06 million for fiscal year 2025, an increase of 18.4% compared to $82.8 million in 2024 [F1]. This leap reflects ongoing demand for loans within its core commercial portfolio alongside disciplined expense management.
Operating cash flow for FY25 was effectively flat year-over-year at about $105 million, slightly dipping from $105.17 million the prior year but maintaining strong cash generation capacity. Capital expenditures underwent a modest reduction (-5.9% YoY), contributing to a healthy free cash flow tally estimated near $97.4 million after subtracting capex from CFO figures [F1]. Equity expanded significantly during this period from $757.6 million at end-2024 to $856.1 million at end-2025, marking an important buffer that supports future growth plans.
Historical performance (annual)
| FY | Net ($mm) | CFO ($mm) | Capex ($mm) | Net YoY |
|---|---|---|---|---|
| 2025 | 98 | 105 | 8 | +18.4% |
| 2024 | 83 | 105 | 8 | +6.2% |
| 2023 | 78 | 86 | 6 | -4.7% |
| 2022 | 82 | 100 | 6 |
Source: SEC companyfacts cache [F1].
Capital returns and efficiency (annual)
| FY | Div ($mm) | FCF ($mm) | ROE% |
|---|---|---|---|
| 2025 | 36 | 97 | 11.5 |
| 2024 | 33 | 97 | 10.9 |
| 2023 | 32 | 79 | 11.1 |
| 2022 | 30 | 93 | 13.0 |
Source: SEC companyfacts cache [F1].
This data underscores CTBI's reliance on stable loan demand and deposit gathering within its regional markets alongside prudent capital reinvestment.
Operating Strengths Rooted in Eastern Kentucky and Neighboring Markets
CTBI operates principally through two subsidiaries: Community Trust Bank (CTB), a commercial bank based in Pikeville, KY; and Community Trust and Investment Company (CTIC), providing fiduciary services located in Lexington, KY [S1][S7]. With assets of approximately $6.7 billion as of December 31, 2025, CTBI serves a geographically focused customer base covering eastern/northeastern/central Kentucky along with southern West Virginia and northeastern Tennessee [S4][S7].
Its offerings encompass traditional commercial loans including construction and mortgage financing; personal loans; cash management; letters of credit; trust services managing over $4 billion in assets under management; brokerage; insurance services; and wealth advisory solutions tailored to these communities [S1]. The company reported community development loans totaling nearly $59.6 million for projects such as affordable housing developments supporting economically challenged regions—a concrete expression of local commitment [S4].
Further enhancing continuity are its human capital strengths: as of late-2025 CTBI employed around 930 full-time employees with a female majority representation of roughly three quarters of staff—and notably high percentages of female leadership in managerial roles including branch management (64%) [S9]. This diverse workforce contributes both cultural alignment with local communities as well as operational stability.
Competitive Landscape: Regional Focus vs. National and Nonbank Rivals
While Community Trust Bancorp benefits from entrenched local relationships borne out of decades-long presence since incorporation in 1980, the environment grows more complex amid intensified competition from larger regional/national banks alongside nimble fintech-oriented non-bank financial firms [S4]. These competitors leverage economies of scale not available to many community banks plus advanced digital platforms that extend their reach into CTBI’s traditional markets without physical branches.
Nonbanks may offer comparatively lower cost structures due to lighter regulatory burdens and differentiated technological delivery mechanisms allowing mobile-based access that resonates especially among younger demographics [S4]. Such developments compel CTBI to focus on service differentiation emphasizing personalized customer service as well as expanding its digital capabilities within regulatory parameters.
The company acknowledges these rivalries while also noting increased pressure on margins caused by shifting funding dynamics such as FDIC insurance pricing changes favoring asset-based assessments that disproportionately challenge smaller deposit bases versus large institutions using alternative funding sources [S6].
Capital Structure and Allocation: Maintaining a Robust Leverage Ratio
CTBI has opted into the community bank leverage ratio (CBLR) framework established by federal regulators designed for banks under $10 billion in assets that maintain strong Tier 1 capital ratios above prescribed thresholds [S5][S7]. For fiscal year-end December 31, 2025 CTBI posted a CBLR ratio of approximately 13.64%, comfortably exceeding the minimum leverage ratio requirement of greater than nine percent needed to benefit from simplified regulatory capital calculations [S5].
This capital adequacy offers the company flexibility for organic loan growth or opportunistic expansion without immediate pressure to raise equity or deleverage—a significant competitive advantage particularly amid volatile macroeconomic conditions [S7]. Liquidity is supported through stable deposits totaling $5.7 billion alongside prudent management of debt maturities detailed in regulatory filings [S5][S7], ensuring no imminent refinancing risk exposures.
The leverage cushion provides security for investors while underpinning conservative underwriting policies necessary for sustainable credit quality maintenance.[F1]
Dividends, Cash Flow, and Shareholder Returns: A Track Record of Steady Income
CTBI has demonstrated consistent dividend increases reflecting growing earnings power: aggregate dividends paid rose from approximately $29.9 million in fiscal year FY22 to nearly $36 million by FY25 representing incremental yield enhancement potential for income-oriented stakeholders [F1][N8].
Operating cash flows remain resilient above the $100 million mark annually supporting reliable payout coverage without sacrificing necessary investment in branch infrastructure or IT upgrades signified by modest capex fluctuations.[F1]
Notably absent are recent share repurchases indicating capital deployment discipline favoring shareholder distributions through dividends rather than buybacks—a decision potentially reflective of prioritizing balance sheet strength amid tightening regulatory scrutiny or economic uncertainty [N4][N8].
Future Outlook: Growth Opportunities and Challenges for CTBI
Explicit guidance details remain limited outside company remarks highlighting new business pipelines bolstered by sustained community lending demand alongside increased traction within trust asset management segments aiming to deepen client relationships in wealth advisory spheres [N3][S1]. However, challenges persist given accelerated innovation cycles driven by fintech entrants requiring ongoing investment into digital banking capabilities [S8]. Cybersecurity continues as an institutional priority given heightened threat landscapes with dedicated executive leadership providing quarterly reassurances via board-level reporting [S14].
A balanced growth strategy centers on extending product suites adapted for local market needs while cautiously monitoring margin pressures from evolving competitor cost structures.
Key Performance Indicators to Watch: Insights from Recent Earnings
Near-term performance will hinge on several measurable factors gleaned from recent quarterly disclosures:
- First-quarter earnings momentum observed signaling continuation of prior trends showing net interest income improvement relative to cost-of-funds shifts [N1][N2].
- Trust assets under management evolution providing signals into client retention/expansion effectiveness.
- Credit quality metrics tracking nonperforming assets relative to portfolio size measuring underwriting discipline [N9].
- Net interest margin trajectory underpinning sustainable profitability amidst rising rates. Monitoring these data points will illuminate whether CTBI can maintain its profitable niche status amidst external pressures.
Disclaimer: This analysis is produced solely for informational purposes relying exclusively on publicly available data sets per citation indexing without providing investment advice or recommendations.
Disclaimer: This is research-only, informational analysis and not investment advice. It may include AI-generated interpretation and general industry context. Always verify important details using primary sources.
Comments