
CTS Corporation: Margin Expansion, Diverse End Markets, and the Tension Between Innovation and Industry Risks
CTS Corporation's recent operational outperformance and improved margins highlight its strategic positioning in diversified sensing, connectivity, and motion markets. Yet, the company faces persistent competitive, supply chain, and geopolitical headwinds that could shape the sustainability of its current momentum.
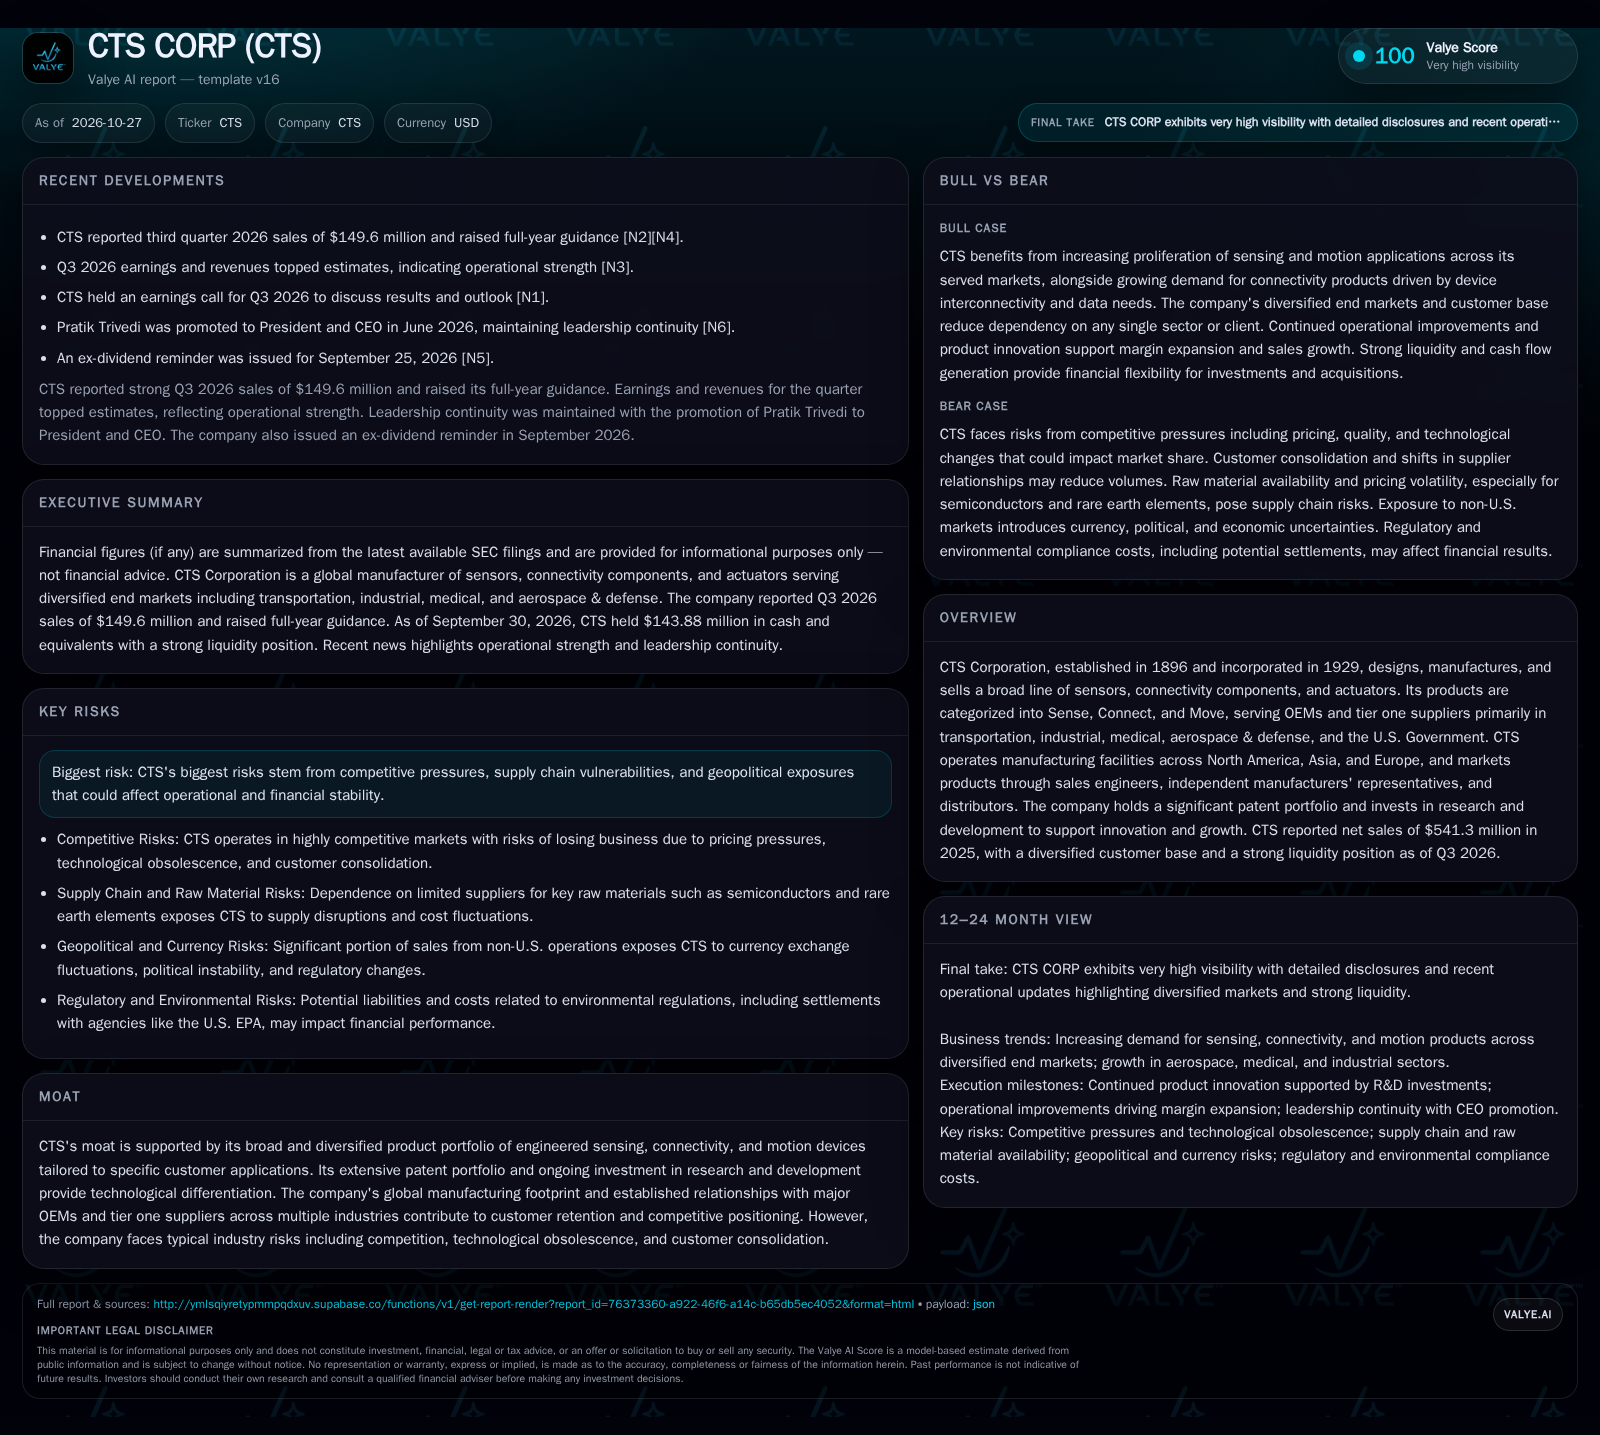
CTS Corporation reported stronger-than-expected Q3 2026 results, with improved gross margins and raised full-year guidance, reflecting operational execution and product mix gains. The business is anchored by a broad customer base and end-market diversity, but remains exposed to raw material and geopolitical risks. The path forward hinges on sustaining innovation-led differentiation while navigating industry cyclicality and consolidation.
CTS Corporation enters late 2026 with clear operational momentum, as evidenced by Q3 earnings and revenues that topped estimates and prompted a full-year guidance raise. The company’s margin expansion and diversified market presence suggest a business model capable of navigating near-term volatility. However, the sustainability of CTS’s current trajectory depends on its ability to continually innovate in sensors, connectivity, and actuators while managing the mounting pressures of raw material volatility, customer consolidation, and fast-evolving technology expectations.
Recent Outperformance and Margin Gains Underpin Strategic Flexibility
CTS Corporation reported Q3 2026 sales of $149.6 million, exceeding analyst estimates and leading to a raised full-year outlook [N2] [N4]. Net income for the quarter was $17.757 million, translating to basic EPS of $0.62 [S2]. These results followed a year in which annual net sales grew 5.2% to $541.3 million, with gross margin improving to 38.4%—a notable jump from 36.4% in 2024, driven by operational improvements and a favorable sales mix [S1].
The company’s end-market exposure remains diversified: Transportation accounted for 43% of 2025 sales, followed by Industrial (26%), Medical (16%), and Aerospace & Defense (15%) [S1]. Toyota and Cummins represented 11.2% and 8.4% of net sales, respectively, highlighting both strong anchor relationships and some customer concentration risk [S1]. The company closed Q3 2026 with $143.88 million in cash, a current ratio of 2.59, and a cash ratio of 1.13 [S2].
How CTS Converts Innovation and Scale into Profitable Growth
CTS’s business model is built on designing and manufacturing engineered components—sensors, actuators, and connectivity devices—sold primarily to OEMs and tier one suppliers. These products typically embed into customer systems, making performance and reliability critical. Pricing power tends to be strongest where CTS offers differentiated, custom-engineered solutions and can leverage its patent portfolio (285 patents globally, with 144 active U.S. patents) [S1]. Standardized components and commodity-like products, however, are more vulnerable to price competition.
Revenue mix is weighted toward the Transportation sector, but meaningful sales also come from Industrial, Medical, and Aerospace & Defense. This diversity can help smooth demand cyclicality, but exposes CTS to different regulatory and supply chain regimes. The company’s sales channels are dominated by its own sales engineers (86% of 2025 sales), with the remainder via independent distributors and representatives [S1]. This direct engagement likely could support larger baskets and closer customer integration, but may also drive up selling costs.
Improved gross margins in 2025 (38.4%, up 200 bps year-over-year) were attributed to operational improvements and a favorable sales mix [S1]. This suggests CTS is either shifting toward higher-value or better-margin products, or achieving scale efficiencies in production. Fixed costs in manufacturing can drive operating leverage, but exposure to raw material inputs—especially semiconductors and rare earth elements—introduces margin volatility. SG&A increased in 2025 due to amortization from the SyQwest acquisition and a one-time EPA-related charge, underscoring that acquired growth and regulatory events can impact cost structure [S1].
R&D investment of $25.3 million in 2025 (4.7% of sales) is consistent with the need for ongoing innovation in competitive, specification-driven markets [S1]. Capital needs are moderate for a component manufacturer, but staying ahead in sensor and connectivity technology requires continual reinvestment.
Navigating a Fragmented Market with Technical and Geographic Moats
CTS operates in intensely competitive markets characterized by a mix of large global conglomerates and nimble niche players. Its competitive edge is rooted in a broad, diversified product portfolio and deep relationships with major OEMs—attributes that can create switching frictions for customers with high certification or system-integration costs.
The company's patent portfolio and ongoing R&D spend provide a degree of technological differentiation, particularly where custom engineering is valued. However, technical obsolescence is an ever-present risk, especially as new sensor modalities and connectivity standards emerge. The pace of innovation in automotive, industrial IoT, and medical device markets means that today's differentiation can erode quickly unless innovation is relentless.
Global manufacturing and sales presence—spanning North America, Asia, and Europe—enables CTS to serve multinational customers and respond to supply chain shocks. Yet, this footprint also increases exposure to geopolitical risks, currency volatility, and region-specific regulatory change. Customer consolidation, particularly in transportation and industrial markets, could shift negotiating power toward large buyers, pressuring pricing and volumes.
CTS’s reliance on a small number of large customers (notably Toyota and Cummins) creates both an embedded moat and a vulnerability: deep integration can lock in business, but customer losses or insourcing could have outsized impacts.
Margin Leverage and New Application Wins Could Drive Outperformance
If CTS sustains its margin expansion while capturing new application opportunities in medical, aerospace, and industrial automation, the company could outgrow sector averages. The favorable mix shift toward higher-margin, more technologically advanced products—possibly enabled by continued R&D and patent-driven innovation—would be a key driver. Successful integration of acquired technologies, such as from SyQwest, could open new verticals or enhance product capabilities.
A confirming signal would be further gross margin expansion, increased R&D efficiency (higher revenue per R&D dollar), and customer wins in emerging markets or applications (e.g., advanced driver-assist, industrial IoT, or medical diagnostics). Additional evidence would include announcements of new multi-year supply agreements, increased patent filings, or a rising share of sales from newer product lines.
Falsification would be evident if gross margins plateau or decline, or if R&D spending ceases to translate into new commercial wins. Loss of major customers or inability to scale new product introductions would also undermine the upside.
Sustained Performance Amid Cyclical and Structural Industry Pressures
The most plausible trajectory for CTS is continued modest sales growth, anchored by its diversified end markets and established customer relationships. Margin improvements driven by operational efficiency and incremental product mix gains could be partially offset by persistent raw material cost pressures and periodic regulatory or environmental charges.
CTS is likely to maintain its innovation cadence, using R&D to defend share in existing markets and secure incremental wins in adjacent applications. Its geographic and customer diversification should help buffer against sector-specific downturns, though concentration among top customers will remain a watchpoint.
Evidence supporting this scenario would include stable to moderately growing revenue, steady gross margins in the high-30s, and manageable increases in SG&A and R&D as a percent of sales. Signs of customer retention, successful price pass-throughs on input cost increases, and continued patent activity would signal stability.
This scenario would be challenged if competitive intensity accelerates, raw material shocks are not passed through, or customer consolidation leads to volume declines.
Supply Chain Disruptions and Customer Consolidation Could Undercut Profitability
A plausible negative chain involves a combination of adverse raw material shocks (e.g., semiconductor or rare earth shortages or price spikes), increased competition leading to price erosion, and the loss or insourcing by a major customer such as Toyota or Cummins. These factors could compress gross margins and stall revenue growth, particularly if CTS is unable to pass higher costs through to customers.
Regulatory or environmental events—such as unplanned charges or settlements—could further squeeze profitability, especially if they coincide with operational disruptions. Geopolitical instability affecting non-U.S. operations (which account for roughly 44% of sales) could also introduce currency or supply chain volatility.
Confirmation of this downside would come from declining gross margins, negative operating leverage, or sequential revenue drops tied to customer attrition or order delays. Rising inventories or working capital needs, if not matched by sales growth, would also be warning signals.
Milestones and Data Points That Will Shape the CTS Investment Thesis
Progression of gross margin: Further expansion or stability above 38% would support the margin improvement thesis; compression would suggest competitive or cost pressure.
Customer concentration trends: Changes in revenue contribution from top customers (Toyota, Cummins) would clarify concentration risk or diversification progress.
R&D efficiency: A useful metric would be new product revenue as a percentage of total sales, if disclosed, to assess innovation ROI.
End-market mix shifts: Increases in Medical, Aerospace & Defense, or Industrial as a share of sales would indicate success in higher-growth or higher-margin verticals.
Raw material cost pass-through: Evidence of successful pricing actions or surcharges during input cost spikes would confirm pricing power.
SG&A and regulatory charges: Recurrence or escalation of environmental or regulatory expenses would pressure margins and require monitoring.
Patent pipeline: The number and quality of new patents filed or granted would help test whether CTS is maintaining technological differentiation.
Non-U.S. sales volatility: Currency-adjusted trends in international sales would illuminate geopolitical and macroeconomic exposure.
Disclaimer: This is research-only, informational analysis and not investment advice. It may include AI-generated interpretation and general industry context. Always verify important details using primary sources.

Comments