
Carvana’s Vertically Integrated Model: Scaling E-Commerce in a Fragmented Used Car Market
Carvana’s rapid retail unit growth in 2026 underscores its expanding operational footprint and technology-driven approach, but persistent execution risks and competitive headwinds remain as the company seeks to translate scale into sustainable margin improvement.
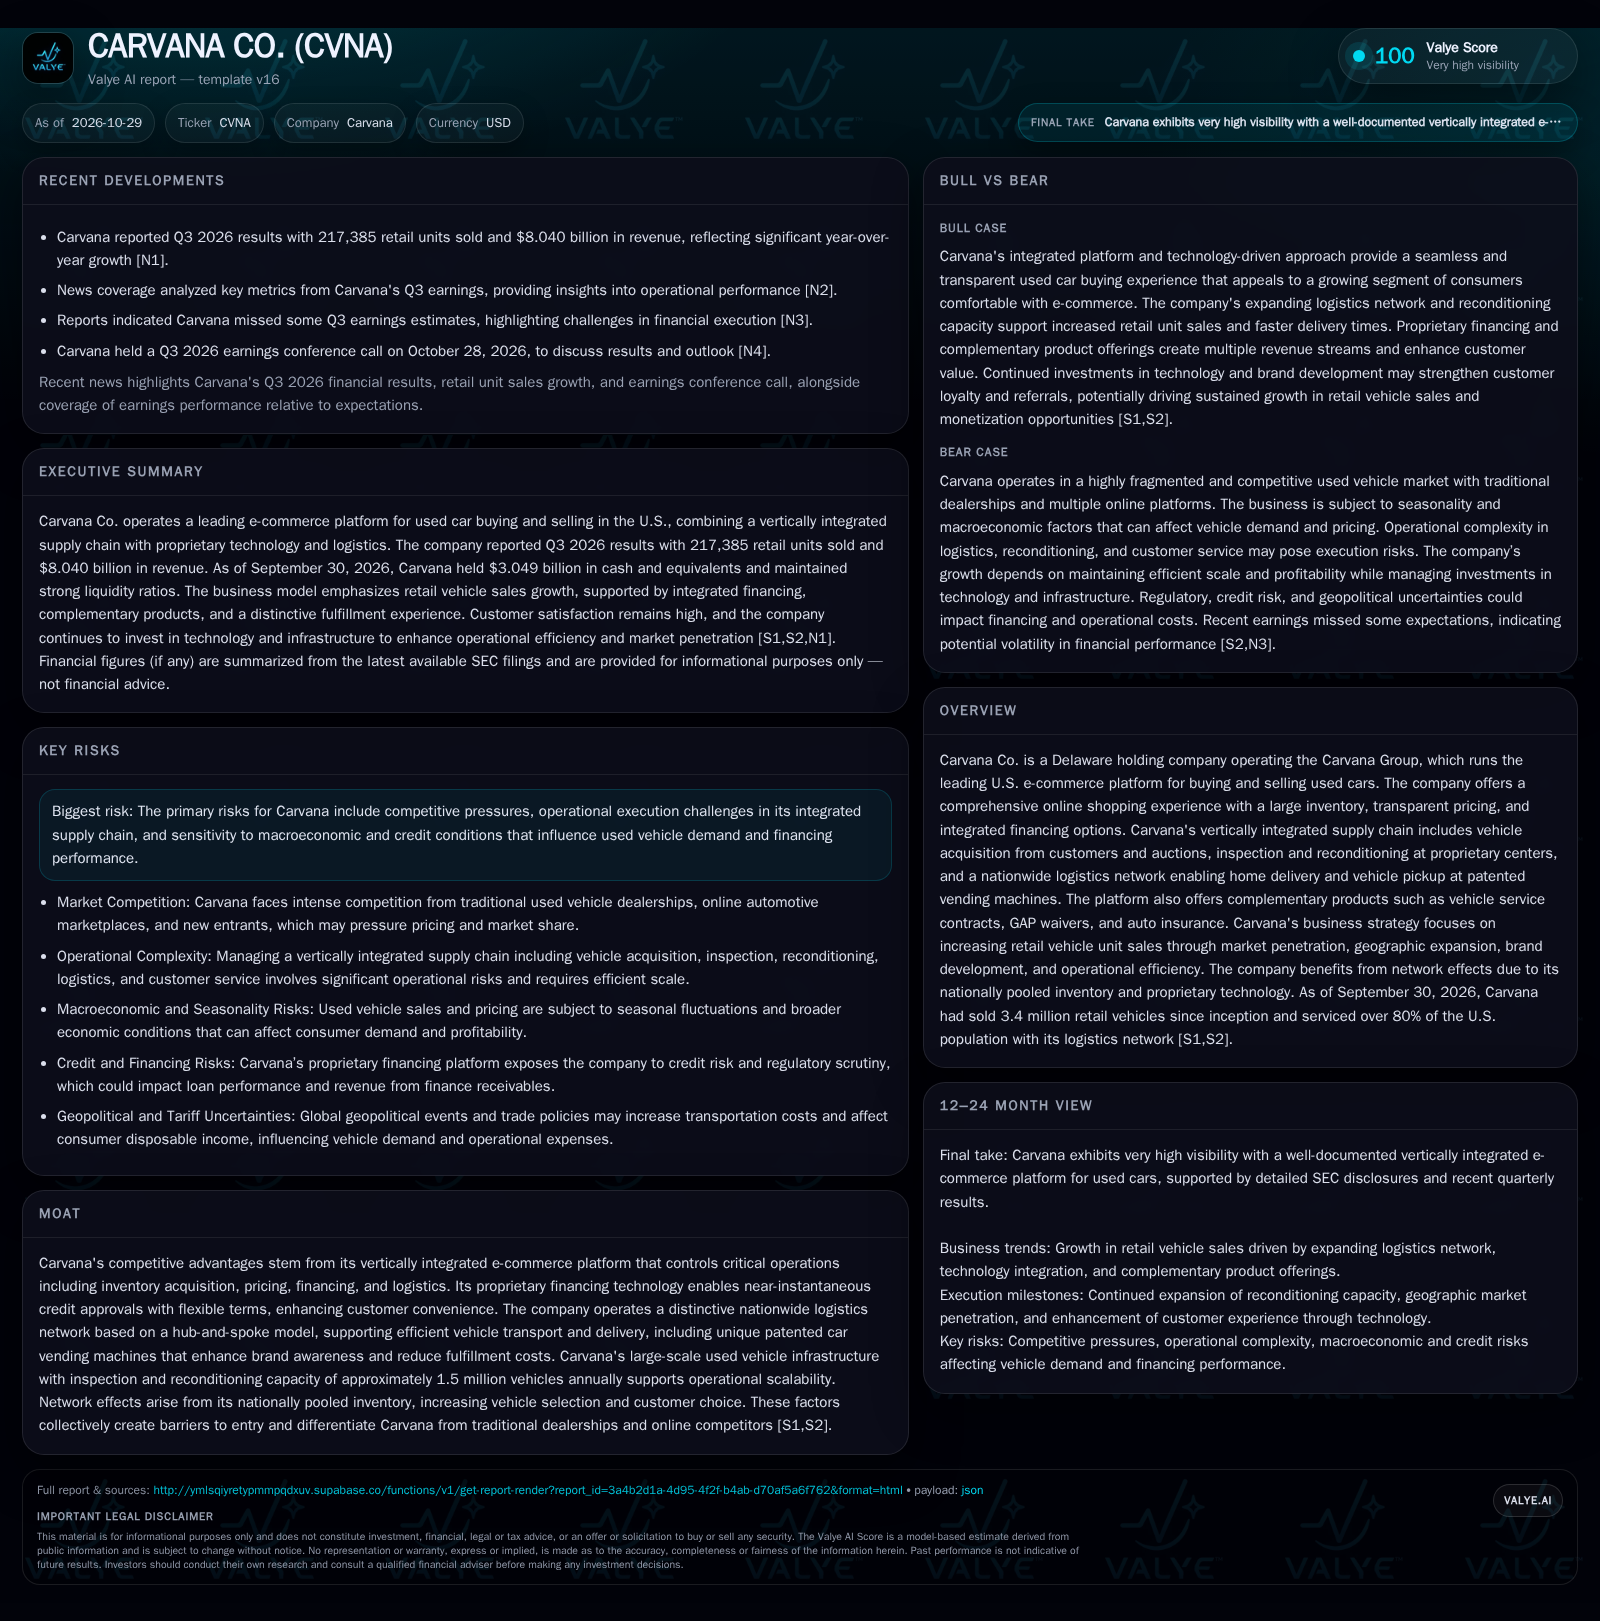
Carvana’s Q3 2026 results highlight a 39% year-over-year increase in retail unit sales and robust revenue expansion, driven by its vertically integrated e-commerce platform and proprietary logistics network. The path forward will depend on whether Carvana can leverage its technology and infrastructure investments to achieve durable profitability while maintaining customer satisfaction and operational efficiency. [S2] [N1] [N3]
Carvana’s Q3 2026 performance demonstrates continued momentum in scaling its vertically integrated e-commerce platform for used cars, with retail unit sales and revenues rising sharply year-over-year. The company’s investments in logistics, technology, and reconditioning capacity have allowed it to expand reach and improve customer experience, positioning Carvana as a formidable player in a fragmented, traditionally offline market. Yet, as evidenced by its recent earnings miss, the challenge remains to convert operational scale and high customer satisfaction into consistent margin expansion and long-term profitability amid significant industry and macroeconomic pressures.
2026 Surge in Retail Volume and Network Reach: What Changes for Carvana’s Trajectory?
Carvana sold 217,385 retail vehicles in Q3 2026, marking a 39.4% year-over-year increase and bringing total retail unit sales for the first nine months of 2026 to 602,103—a comparable 39% growth over the prior period. This surge in volume reflects the company’s successful efforts to expand its logistics and reconditioning infrastructure, which now covers over 80% of the U.S. population and enables faster delivery times. Q3 2026 revenue reached $8.040 billion, with $6.1 billion from retail vehicle sales and $1.3 billion from wholesale operations. Carvana’s liquidity position at quarter-end was robust, with $3.049 billion in cash and a current ratio of 4.05. However, the company missed some earnings estimates, signaling that rapid growth has not yet translated into predictable bottom-line performance. [S2] [N1] [N3]
Decoding Carvana’s Revenue Streams and Margin Levers
Carvana’s economics are defined by a multi-pronged revenue model: retail vehicle sales, wholesale vehicle sales, gains on finance receivables, and complementary products such as service contracts and insurance. Retail vehicle sales are the largest contributor, but the company’s ability to cross-sell financing and ancillary products is essential for driving blended gross margins. Proprietary loan origination technology allows Carvana to capture additional economics from financing, though it also exposes the business to credit and regulatory risks.
The vertically integrated approach means Carvana bears substantial fixed costs—reconditioning center infrastructure, logistics hubs, and technology development. This structure offers the potential for operating leverage if volumes continue to scale, as incremental vehicle throughput can be absorbed with less-than-proportional increases in overhead. However, execution risk remains: bottlenecks in reconditioning, logistics inefficiencies, or adverse economic conditions could quickly erode margins. The company’s capital intensity is high relative to pure marketplaces, requiring ongoing investment to maintain network speed and inventory breadth.
Complementary product attachment (VSC, GAP waivers, insurance) is a margin lever, but also subject to consumer uptake rates and third-party partnerships. Wholesale sales provide a necessary outlet for vehicles that do not meet retail standards, but typically carry lower margins. Seasonality and used vehicle price volatility introduce further uncertainty into both revenue and gross profit trajectories.
How Carvana’s Integration and Technology Stack Up Against Dealerships and Digital Rivals
Carvana operates in a U.S. used car market that remains highly fragmented, with traditional dealerships, legacy auto retailers, and a growing cohort of digital-first competitors all vying for share. The company’s competitive advantages stem from its vertically integrated model: control over vehicle acquisition, inspection, reconditioning, logistics, and customer experience under one platform. This enables faster delivery, broader selection, and consistent quality standards—features that can be difficult for fragmented dealer networks to replicate at scale.
Proprietary technology—particularly in financing and digital merchandising—supports customer conversion and streamlines operations. Nationally pooled inventory, augmented by photo technology for virtual tours, provides buyers with greater transparency and choice. The logistics network, featuring a hub-and-spoke model and unique vending machine pickup options, reduces fulfillment costs and enhances brand awareness.
Despite these strengths, barriers to entry are not insurmountable. Established auto retailers are investing in digital capabilities, while online marketplaces can potentially match Carvana’s reach without the same capital intensity. The company’s estimated 1.6% U.S. used car market share as of 2025 leaves ample room for growth but also underscores the challenge of displacing entrenched dealer relationships and overcoming consumer hesitancy for high-ticket online purchases.
Leveraging Scale and Technology to Unlock Margin Expansion
The favorable scenario for Carvana hinges on sustained volume growth translating into significant operating leverage. If the company continues to penetrate new markets, increase vehicle throughput at existing reconditioning sites, and optimize logistics efficiency, fixed costs per unit could decline materially. Proprietary financing and high attachment rates for complementary products such as service contracts and insurance could further boost gross margins and diversify revenue streams.
Customer satisfaction metrics—currently averaging 4.6 out of 5.0 from over 291,000 surveys—suggest the brand is resonating with buyers, increasing the potential for repeat purchases and referrals. Continued investment in digital merchandising and AI-driven pricing tools could improve inventory turns and reduce days-to-sale, freeing up working capital.
Confirmation of this scenario would come from: (1) sustained double-digit year-over-year unit growth even as the base scales, (2) sequential improvement in gross profit per unit and blended margins, (3) evidence of cost discipline in logistics and reconditioning, and (4) rising penetration of proprietary financing and ancillary products. A reduction in earnings volatility and consistent outperformance relative to consensus estimates would further support the upside case.
What a Maturing E-Commerce Platform Could Deliver in a Competitive Market
The most plausible outcome is that Carvana sustains strong top-line growth as it consolidates share in a still-fragmented market, but faces ongoing margin pressures from competitive pricing, seasonality, and operational complexity. As the company’s network matures, incremental investments in logistics and reconditioning are likely to generate diminishing returns on efficiency, with fixed costs remaining high relative to variable margin expansion.
Carvana’s proprietary financing and ancillary products will likely continue to provide incremental revenue, but credit and regulatory risks could cap their contribution. The company’s ability to expand into additional MSAs and increase inventory selection may drive further unit growth, but customer acquisition costs could rise as digital competition intensifies.
This scenario would be confirmed by: (1) continued year-over-year retail unit and revenue growth in the high single to low double digits, (2) stable or modestly improving gross profit per unit, (3) periodic earnings volatility tied to used vehicle price swings and macroeconomic factors, and (4) no significant deterioration in customer satisfaction or delivery speed.
Where Scale Fails to Deliver Margin: Execution Risks and Macro Sensitivity
In a less favorable scenario, Carvana’s rapid expansion strains its operational model, leading to logistics bottlenecks, reconditioning delays, and rising per-unit costs. If the company fails to maintain high standards in vehicle quality or delivery timeliness, customer satisfaction could slip, driving negative word-of-mouth and higher return rates. Increased competition from both digital and traditional channels could force deeper discounting, eroding gross margins even as unit volumes rise.
Macroeconomic headwinds—such as tightening consumer credit, rising interest rates, or a cyclical downturn in used vehicle demand—could depress both sales volume and financing revenue. The company’s exposure to credit risk through its proprietary lending platform may result in higher delinquencies or losses, impacting overall profitability.
Evidence for this scenario would include: (1) stagnation or decline in retail unit sales growth, (2) sequential drops in gross profit per unit, (3) elevated operating expenses outpacing revenue gains, (4) deterioration in customer satisfaction scores, and (5) missed earnings estimates becoming the norm rather than the exception.
Testing Carvana’s Model: Quantitative and Qualitative Markers to Track
Trends in retail vehicle unit sales growth on both a quarterly and annual basis, especially as the company’s base expands and market penetration deepens.
Gross profit per retail unit and blended company gross margin, which would indicate whether operational leverage and cross-selling are translating into sustainable economics.
Attachment rates for proprietary financing, vehicle service contracts, GAP waivers, and insurance—if disclosed—as a measure of ancillary revenue scaling.
Average delivery time from purchase to customer receipt, reflecting logistics efficiency and customer experience.
Inventory turnover rates and days-to-sale for vehicles, which would help test whether technology and logistics investments are driving faster inventory movement.
Customer satisfaction scores and seven-day return rates as indicators of brand strength and fulfillment quality.
Operating expense trends as a percentage of revenue, to monitor cost discipline and scalability.
Quarterly updates on liquidity and capital expenditure commitments, especially if macro or credit conditions tighten.
Disclaimer: This is research-only, informational analysis and not investment advice. It may include AI-generated interpretation and general industry context. Always verify important details using primary sources.

Comments