
Community Health Systems Advances Regional Network Strategy Amid Reimbursement and Volume Pressures
CHS updates on Q2 2026 performance highlight operational challenges balancing outpatient growth with regulatory reimbursement shifts.
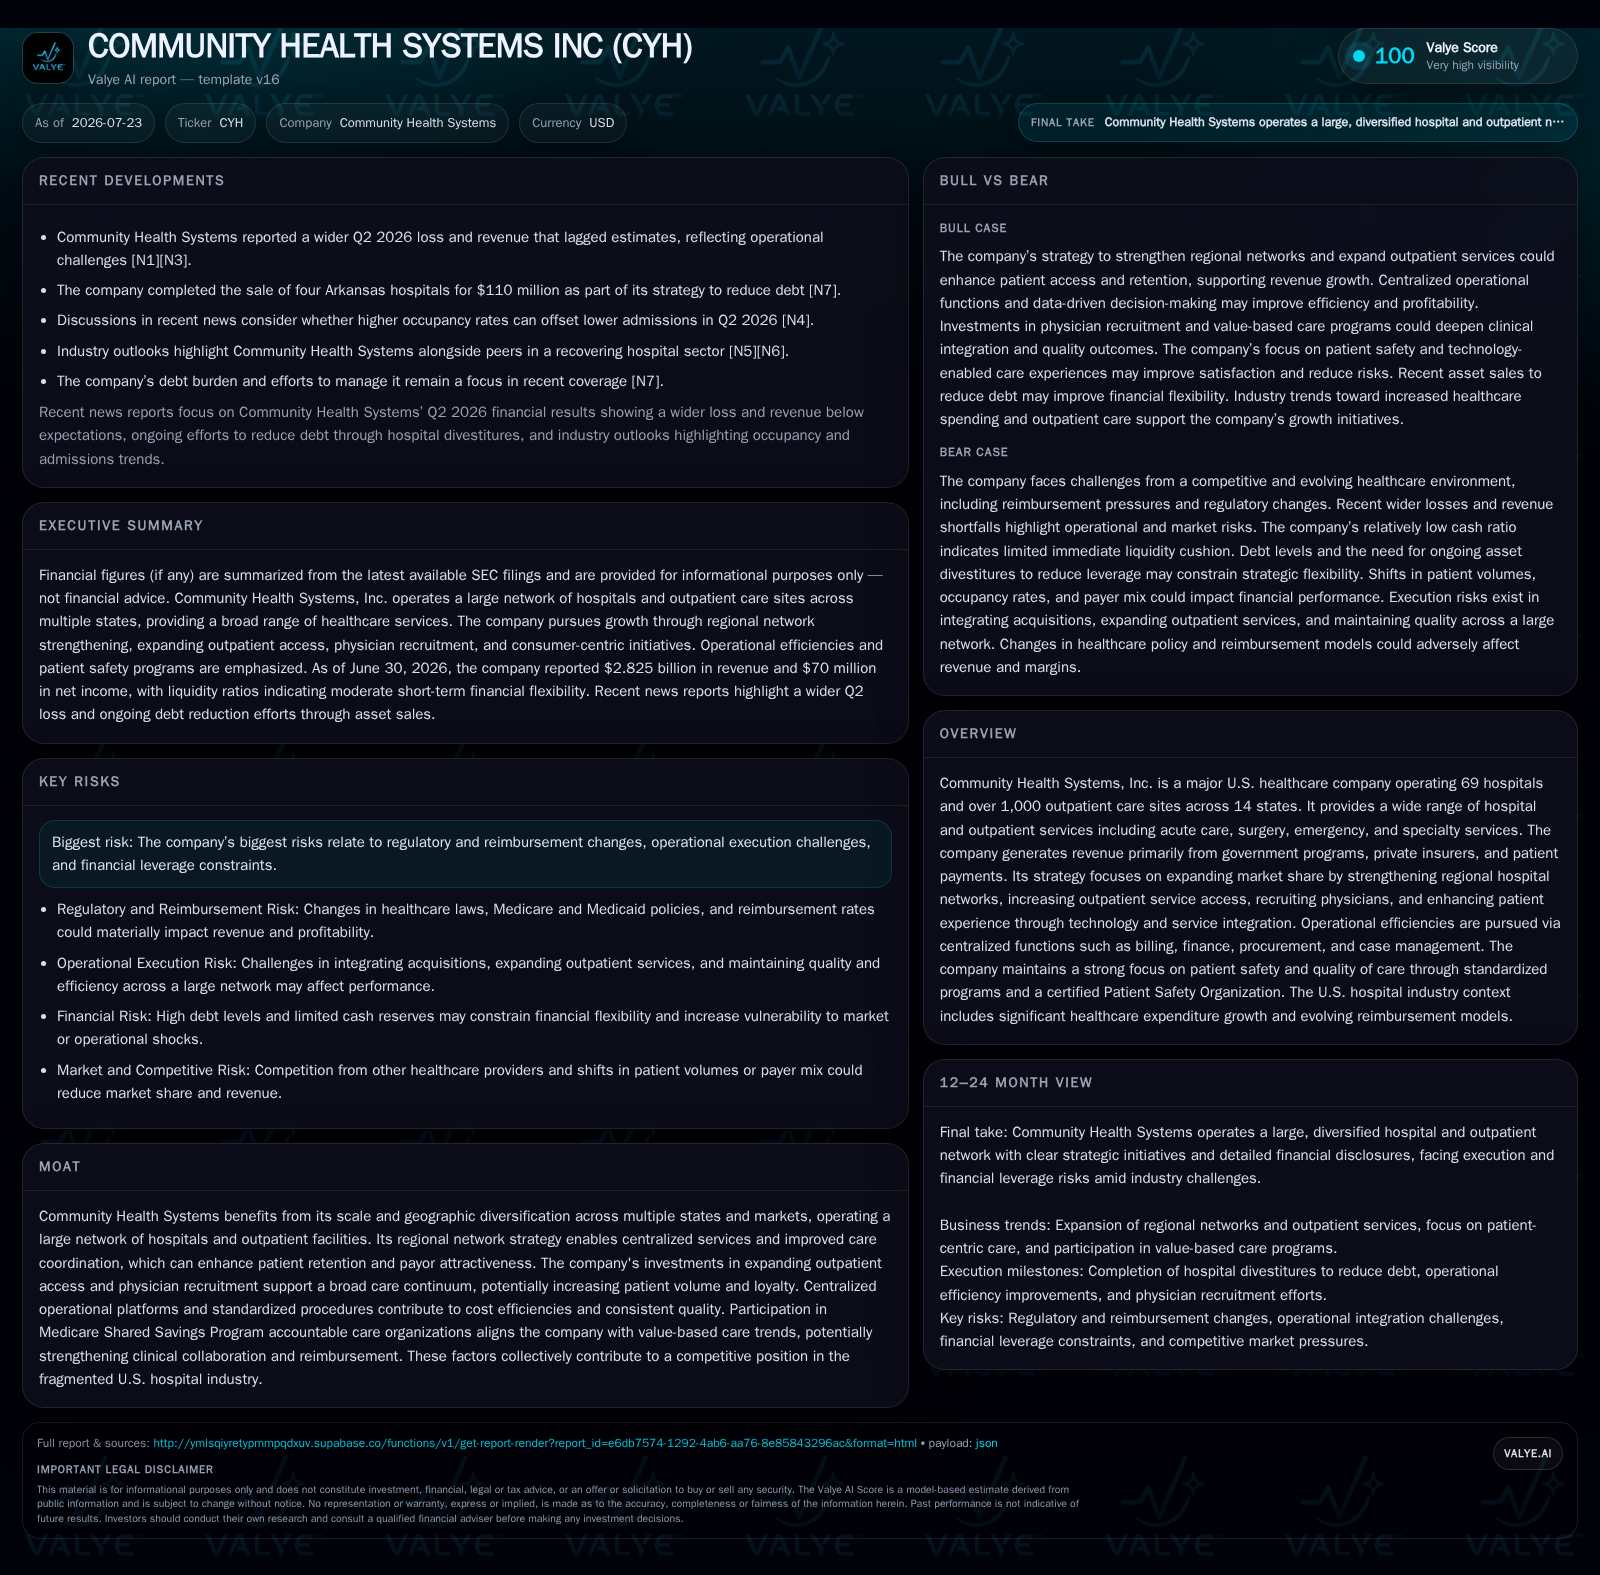
Community Health Systems, Inc. (CYH) reported a challenging second quarter of 2026 marked by lower hospital admissions offset partially by higher outpatient visit volume and occupancy rates. The company continues to focus on expanding its outpatient footprint, physician recruitment, and regional network consolidation, all while navigating ongoing reimbursement pressures from Medicare and Medicaid programs. Centralized operational efficiencies and investments in patient safety remain strategic priorities. However, high leverage and potential asset impairments introduce financial risks, underscoring the importance of execution in a complex regulatory environment.
Recent Operating Update: Navigating Volume Shifts and Reimbursement Dynamics
Community Health Systems (CYH) disclosed its second-quarter 2026 performance revealing nuanced operational trends. While hospital admissions experienced softness—reflecting broader industry shifts towards outpatient care—outpatient visit volumes rose, contributing to improved occupancy levels across their hospital network [S2][N3]. This volume dynamic is emblematic of ongoing healthcare consumption changes driven by CMS policy reforms such as the phased elimination of the Inpatient Only List finalized in late 2025, allowing procedures reimbursable by Medicare outside inpatient settings. CHS notes that this reform has bolstered demand for outpatient services relative to inpatient stays, creating a revenue mix transition challenge but also opportunity for expansion in ambulatory offerings [S1].
Charity care remains a significant factor in revenue recognition as the company does not pursue collections for patients financially unable to pay nor those excluded from government program reimbursements [S2]. This treatment results in certain charges being excluded from net operating revenues, with amounts assessed according to federal poverty guidelines. Meanwhile, supplemental Medicaid reimbursement programs continue to provide partial offsets to indigent care costs, though these programs require periodic CMS approval and utilize state-federal funding blends including provider fees that can impact overall margins
Business Model: Integrated Regional Network with Outpatient Emphasis
CYH’s business model centers on delivering a broad spectrum of acute inpatient care alongside expanding outpatient services via more than 1,000 access points including freestanding emergency departments, imaging centers, cancer centers, ambulatory surgery centers, urgent care locations, and physician practices spread across 14 states [S1]. Revenue originates primarily from government payors—Medicare and Medicaid—private insurers, and direct patient payments. The company leverages centralized operational platforms encompassing billing, finance, procurement, and case management designed to standardize processes while controlling costs.
A critical competitive lever is physician recruitment; CYH employs about 1,700 physicians plus an additional cohort of licensed practitioners who serve as vital referral sources influencing patient volume flows into their hospital network [S1][S22]. Their strategy includes aligning with local physicians and leveraging partnerships or ownership interests to foster tighter integration of care delivery locally. By operating in multiple regional markets with diversified payer mixes and patient demographics, they spread risk and capitalize on economies of scale from shared services hubs while tailoring programs like patient safety initiatives under their certified Patient Safety Organization status
Revenue drivers hinge on inpatient admissions (linked closely with case mix severity), outpatient visit volumes (a growing focus), reimbursement rates influenced by negotiated contracts or CMS policies, payer mix shifts toward managed care or governmental plans, and operational efficiency measured through metrics such as average length of stay and readmission rates.
Industry Structure and Competitive Position
The hospital services sector remains highly fragmented with CYH positioned among large for-profit operators alongside peers like Tenet Healthcare, Universal Health Services, and HCA Healthcare. Competition arises not only from municipal or non-profit hospitals—which benefit from tax exemptions—but increasingly from integrated health systems advancing physician employment models or clinical integration networks such as accountable care organizations (ACOs). These competitors often have greater capital flexibility or specialized program offerings like research capabilities absent in CYH’s portfolio [S22].
Furthermore, insurance providers’ cost-containment strategies place pressure on hospital pricing power via managed care contract negotiations emphasizing shorter inpatient stays or shifting procedures toward outpatient facilities. CYH’s investment in expanding its outpatient footprint aims to respond competitively to this trend while retaining market share through service diversification.
Regulatory scrutiny notably around compliance with Medicare/Medicaid billing rules creates ongoing audit risks. CHS actively manages these through appeals mechanisms against Recovery Audit Contractor (RAC) denials but acknowledges potential negative impacts on future cash flows if audit activities intensify without favorable reversals [S19][S1]
Growth Drivers
Population aging combined with rising chronic disease prevalence underpin steady demand for acute and specialty hospital services regionally. CHS capitalizes on these demographic tailwinds by reinforcing core hospital capabilities while simultaneously expanding outpatient access points—a response aligned with payer incentives favoring site-of-care cost reductions.
Enhanced physician recruitment expands referral pipelines directly impacting patient volume growth capabilities [S1]. Supporting infrastructure investments in technology also improve patient experience quality—a differentiator increasingly valued by payors and consumers alike. Participation in Medicare Shared Savings Program ACOs positions the company favorably within value-based care frameworks offering potential upside through shared incentive payments linked to clinical outcomes improvements
Operational efficiency initiatives targeting centralized supply chain management and standardized clinical protocols contribute margin stability amid fluctuating reimbursement environments.
Risks and Watchpoints
The foremost risk stems from evolving government reimbursement policies that may reduce payment rates or change covered service scope—exemplified by recent CMS reforms shifting procedural reimbursements toward outpatient cohorts. Fluctuations in payer mix towards government programs often imply lower average reimbursement per admission than private insurers.
Operational challenges include maintaining consistent quality amid geographic diversification while integrating newly recruited physicians effectively within care models. Payment denials from audits remain a financial uncertainty backdrop.
Financially, CYH's leverage is considerable; total debt stood near $10.6 billion at year-end 2025 against modest cash reserves approximating $149 million mid-2026 yielding net debt over $10.4 billion [F1][S2]. Such high indebtedness raises refinancing risk sensitivity especially should operating cash flow falter.
Recent goodwill impairments totaling roughly $417 million during H1 2026 associated with divested hospitals add caution regarding asset utilization efficiency amid portfolio optimization efforts [S20]. Moreover, competition from tax-exempt governmental hospitals capable of subsidizing service expansions challenges pricing flexibility.
What To Watch Next
Critical upcoming milestones include monitoring Q3 admissions trends versus seasonal patterns given historical volume sensitivity alongside outpatient visit growth continuity. Tracking CMS policy developments impacting both reimbursement rates and coverage scope will be essential.
Execution success on outpatient access expansion coupled with physician network growth metrics will signal the effectiveness of strategic initiatives targeting volume recovery.
Financially scrutinizing interest expense trends relative to earnings capacity can indicate stress points linked to leverage management amid operating margin pressures noted recently.
Appeals outcomes regarding RAC audit denials remain important barometers for cash flow stability.
Guidance updates provided around earnings forecasts should be analyzed closely for shifts indicating either heightened operational headwinds or easing cost curves.
Financial Profile Discussion
As of June 30, 2026, Community Health Systems held approximately $149 million in cash and equivalents against current liabilities of about $2 billion resulting in a current ratio near 1.53—a moderate liquidity cushion supporting near-term obligations [F1][S2]. Total debt outstanding was approximately $10.6 billion at the end of calendar year 2025 with net debt effectively around $10.4 billion after accounting for available cash balances [F1], reflecting significant leverage typical within large hospital operators but necessitating prudent cash flow management.
Interest expense remains a material recurring charge; Q2 interest expense totaled roughly $206 million net impacting profitability metrics significantly given ongoing margin pressure from reimbursement changes [S2]. Capital expenditure levels are guided largely by facility maintenance needs alongside outpatient capacity expansions aiming to sustain competitive positioning long term.
In summary, CYH’s financial profile underscores the importance of balancing debt servicing demands through sustainable operational performance enhancements amidst healthcare sector regulatory complexity.
This analysis synthesizes publicly available SEC filings up to July 23, 2026 and related market commentary without providing investment advice or research views.
Disclaimer: This is research-only, informational analysis and not investment advice. It may include AI-generated interpretation and general industry context. Always verify important details using primary sources.

Comments