
Dow Inc.: Pricing Power, Cost Actions, and the Strategic Stakes of Chemical Industry Volatility
Dow’s 13% sales growth in Q3 2026 was driven by broad-based price increases even as Asia Pacific volumes declined. The company’s ongoing cost-reduction program and feedstock flexibility are central to navigating energy and geopolitical shocks, but volume headwinds and execution risks remain as the sector faces persistent macro uncertainty.
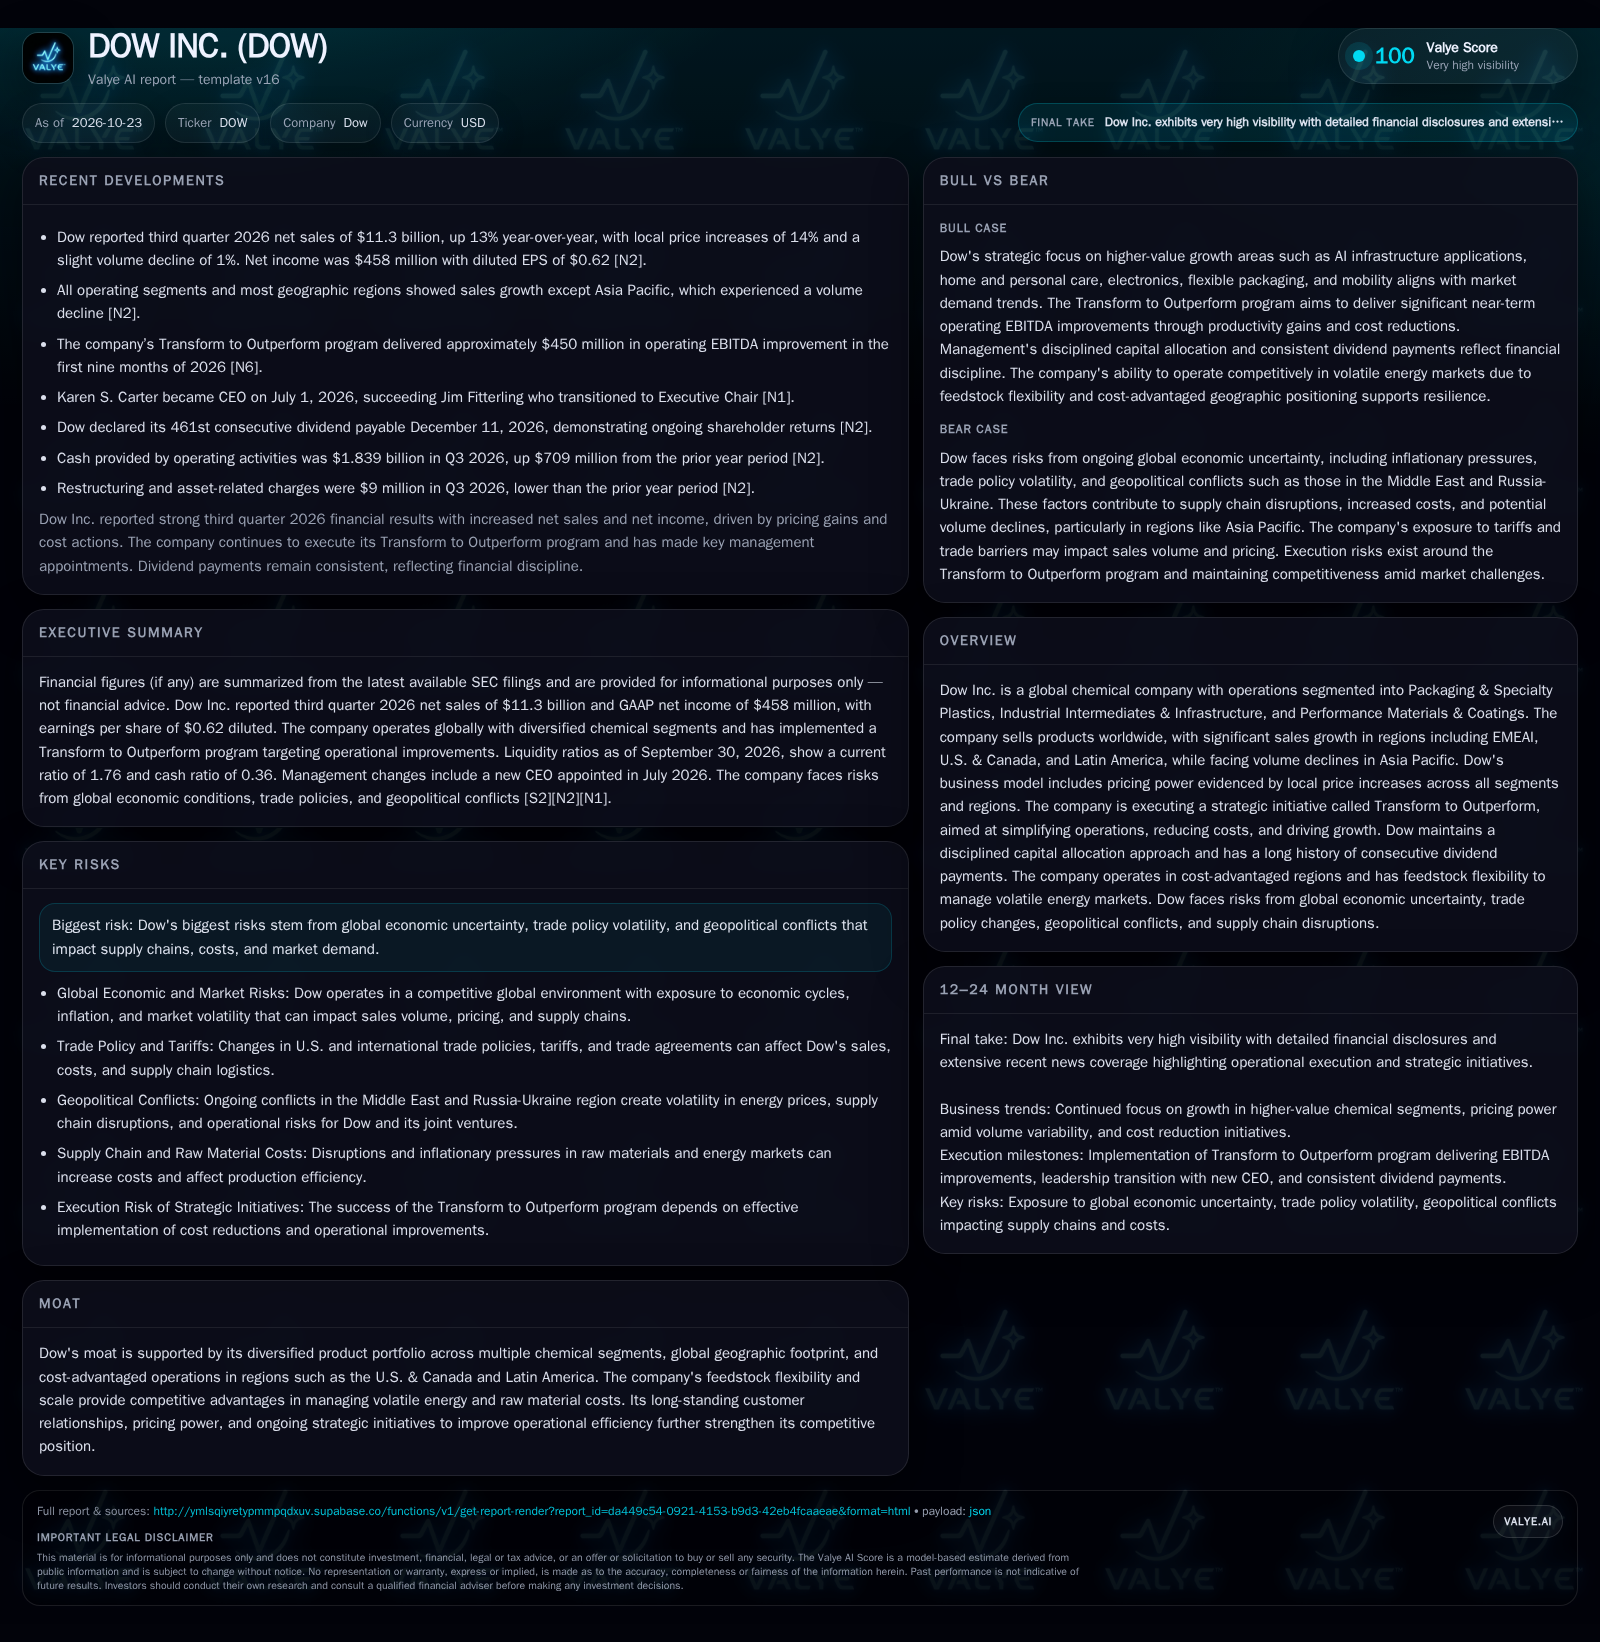
Dow Inc. posted $11.3 billion in Q3 2026 net sales, up 13% year-over-year on price gains, while volumes softened in Asia Pacific. The 'Transform to Outperform' initiative delivered $450 million in operating EBITDA improvement year-to-date, and recent leadership transition brings new strategic stewardship. Execution on cost and pricing will be crucial as Dow contends with volatile global demand, energy markets, and geopolitical risk. [N2] [N6]
Dow Inc.’s latest results underscore the chemical giant’s ability to flex pricing power across its diversified portfolio, even as global demand patterns remain uneven and geopolitical risks intensify. With Q3 2026 net sales up 13% on the back of broad price hikes, Dow is leaning into self-help levers—most notably its 'Transform to Outperform' program, which has already delivered substantial EBITDA improvements. However, volume declines in Asia Pacific, persistent energy market volatility, and new leadership at the helm mean that the company’s next phase will test both its operational discipline and strategic adaptability.
Recent Results: Pricing Outweighs Volume Headwinds Amid Strategic Transition
Dow reported $11.3 billion in net sales for Q3 2026, a 13% increase year-over-year, primarily attributed to price increases implemented across all business segments and geographies. While this pricing strength was notable, the company did experience volume declines in Asia Pacific, suggesting uneven end-market demand and potential regional overcapacity or demand-side pressures. [N2]
Operationally, Dow’s 'Transform to Outperform' program delivered $450 million in operating EBITDA improvement in the first nine months of 2026, reflecting ongoing cost discipline and structural simplification. [N6] This effort, paired with targeted cost reductions, has helped mitigate the impact of global economic and supply chain disruptions.
Leadership transition is also material: Karen S. Carter assumed the CEO role in July 2026, marking a new era of strategic oversight as Jim Fitterling transitioned to Executive Chair. [N1] This change comes at a time when Dow’s execution on cost, pricing, and regional diversification will be critical to sustaining performance.
Liquidity as of September 30, 2026, included $4.14 billion in cash and equivalents, a current ratio of 1.76, and a cash ratio of 0.36. The company reported cash and liquidity metrics for the period; these figures do not by themselves establish operating runway, investment capacity, financial flexibility, or financing capacity. [S2]
How Dow’s Operating Model Converts Scale and Flexibility into Margin Opportunity
Dow’s business model relies on high fixed-cost asset bases—large chemical complexes and integrated production networks—that benefit from high utilization rates and economies of scale. When volume is stable or rising, incremental revenue (especially from price increases) tends to drop through to margins, driving operating leverage.
Recent results suggest that pricing, rather than volume, has been the principal lever for revenue growth. This dynamic can be double-edged: while price increases can offset input cost inflation and demand softness, they may not be sustainable if downstream customers resist or if competitors undercut. The company’s feedstock flexibility—especially in cost-advantaged regions like the U.S. & Canada and Latin America—allows it to optimize input costs in volatile energy markets, which is critical given the sector’s exposure to oil, natural gas, and naphtha pricing swings.
Dow’s capital needs are ongoing, supporting both maintenance and selective growth investments, but its ability to fund these from internally generated cash flow has improved with stronger operating results. However, persistent macro headwinds, such as inflation and trade barriers, could compress margins if pricing power diminishes or cost inflation accelerates.
Operating leverage remains a central feature of Dow’s economics: cost reductions and efficiency gains (as pursued through the Transform to Outperform program) have a magnified impact on EBITDA and cash flow, but this leverage also works in reverse if volumes or prices fall meaningfully.
Dow’s Defensible Segments and the Limits of Scale in a Globalized Chemical Market
Dow’s competitive position is anchored by its diversified product portfolio—spanning packaging, specialty plastics, industrial intermediates, and performance materials—and its global manufacturing footprint. The company’s ability to operate in cost-advantaged regions and leverage feedstock flexibility are significant hedges against raw material and energy price volatility.
Long-term customer relationships and a reputation for reliable supply add to Dow’s stickiness, especially in applications where product quality and consistency are critical (e.g., packaging films, coatings, and specialty materials). However, chemical industry switching costs are typically moderate; while process integration and qualification cycles can slow customer churn, price and supply security remain paramount.
Competition is intense and global, with peer categories including other large diversified chemical firms, regional producers, and increasingly, specialty chemical players targeting higher-margin niches. Technology substitution—such as bio-based materials or circular/renewable feedstocks—poses a longer-term challenge, requiring ongoing investment and innovation.
Geopolitical risks and trade policy shifts can abruptly alter regional cost structures and competitive dynamics, particularly for companies with joint ventures or manufacturing assets in volatile regions like the Middle East or Eastern Europe.
If Pricing Power and Cost Actions Persist: Margin Expansion and Resilient Cash Flow
The most favorable scenario for Dow is one in which it continues to exercise pricing power across its portfolio while cost-reduction and operational efficiency gains from the Transform to Outperform program flow through to the bottom line. If global demand stabilizes or rebounds—particularly in Asia Pacific—volumes could recover, further amplifying the margin impact of higher prices and lower costs.
Feedstock flexibility and cost-advantaged production would allow Dow to maintain or expand share in key regions, even as energy markets remain volatile. A successful integration of new leadership could accelerate decision-making and unlock new growth initiatives, especially in higher-value applications like AI infrastructure, electronics, and advanced packaging.
Confirmation of this scenario would come from sustained or rising EBITDA margins, positive operating cash flow trends, and evidence of price retention even as input costs fluctuate. A return to volume growth in Asia Pacific or new product launches in growth segments would further validate the upside case.
Steady-State: Cost Discipline Offsets Mixed Demand and Ongoing Volatility
The most plausible path for Dow is a continuation of recent trends: pricing remains firm in most segments, but volume growth is mixed across regions, with Asia Pacific lagging due to local economic or competitive pressures. The company continues to deliver incremental cost and efficiency gains, offsetting inflation and supply chain challenges, but structural headwinds from global macro uncertainty and energy price volatility persist.
Management’s focus remains on operational execution, margin protection, and selective capital investment rather than aggressive expansion.
Evidence for this scenario would include stable or slightly improving margins, flat to modestly positive cash flow, and continued cost-reduction milestones, even as top-line growth is driven more by price than by volume. Persistent volume softness in Asia Pacific or other emerging markets would reinforce the view that demand recovery will be gradual and uneven.
Adverse Chain: Volume Declines Meet Pricing Pushback and External Shocks
A negative scenario could unfold if global demand deteriorates further, leading to more pronounced volume declines—especially in Asia Pacific and potentially spreading to other regions. If competitors respond with aggressive pricing or if customers push back on recent price increases, Dow could face margin compression as its ability to offset cost inflation erodes.
Geopolitical escalation (e.g., Middle East or Russia-Ukraine conflicts) could disrupt supply chains, spike energy costs, or impair joint venture operations, further straining profitability. Execution missteps in the Transform to Outperform program—such as delayed cost savings or higher restructuring charges—would exacerbate financial pressure.
Confirmation of this scenario would be seen in declining EBITDA margins, negative operating cash flow trends, rising restructuring or impairment charges, and/or further volume declines in key regions. Supply chain bottlenecks or raw material shortages would amplify the downside risk.
What Will Determine Dow’s Strategic Trajectory and Margin Sustainability?
Track the pace and magnitude of cost-reduction and EBITDA improvement delivered under the Transform to Outperform program; specific quarterly updates and year-end targets would help test execution.
Monitor pricing trends by segment and geography—particularly whether recent price increases are sustained or rolled back in response to customer or competitive pressures.
Watch for volume recovery in Asia Pacific and other emerging markets; quarterly regional volume data (if disclosed) would be a key indicator of demand normalization.
Observe the stability of operating cash flow, especially in the context of changing energy prices and working capital swings.
Assess the impact of geopolitical events and supply chain disruptions on Dow’s Middle East joint ventures and broader operations; management commentary or disclosure of lost production/sales would be material.
Evaluate any changes in capital allocation strategy under new CEO Karen S.
Track restructuring and asset-related charges for signs of either progress or setbacks in operational simplification.
Disclaimer: This is research-only, informational analysis and not investment advice. It may include AI-generated interpretation and general industry context. Always verify important details using primary sources.

Comments