
DiamondRock Hospitality’s Financial Rebound and Capital Strategy in 2025
DiamondRock Hospitality Co demonstrated notable earnings growth and a prudent capital allocation approach in 2025, balancing dividends and buybacks while managing legal risks.
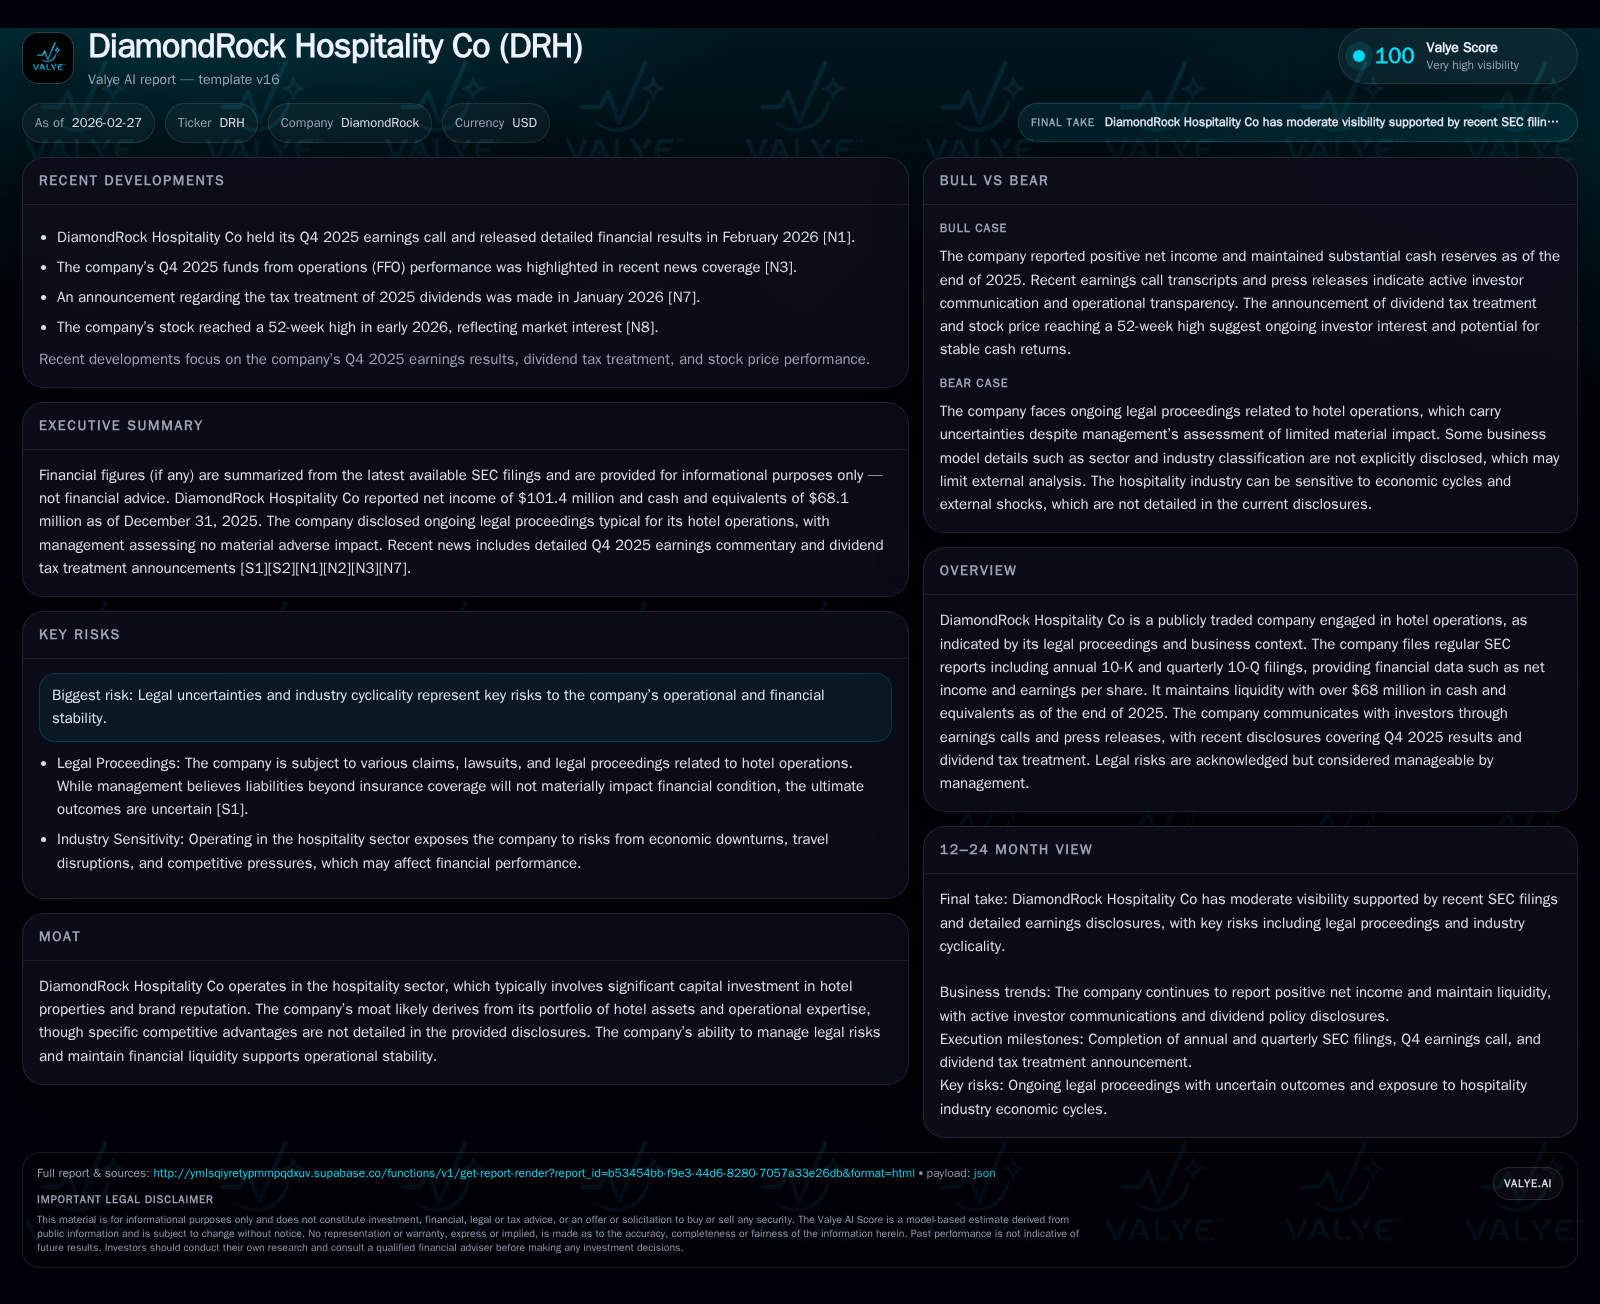
DiamondRock Hospitality Co posted a significant increase in net income for fiscal year 2025, more than doubling compared to 2024, with operating cash flow also improving. The company managed legal uncertainties cautiously but maintained confidence that claims would not materially impact financials. DiamondRock pursued disciplined capital allocation by enhancing dividends and conducting sizable share repurchases, supported by solid free cash flow and maintained liquidity. Future growth is expected to hinge on operational efficiencies and market demand amid ongoing industry cyclicality.
From Volatility to Growth: DiamondRock’s Historical Financial Review
DiamondRock Hospitality's financial trajectory over recent years underscores a marked rebound after pandemic-related disruptions. The company endured a severe operating loss of -$219 million in FY2020, reflecting the hospitality sector's sharp contraction during that period. However, by FY2022 net income had returned to positive territory ($109 million), with continued earnings stability seen through FY2023 and FY2024, culminating in $101.4 million of net income in FY2025 — representing a strong 111% increase over the prior year [F1].
Operating income figures mirror this recovery, moving from negative territory back into gains before adjustments in later years. Operating cash flow rose to $243.65 million in FY2025 from $224.41 million in FY2024, indicating robust cash generation capacity supporting operational resilience.
Historical performance (annual)
| FY | Net ($mm) | CFO ($mm) | Net YoY |
|---|---|---|---|
| 2025 | 101 | 244 | +111.1% |
| 2024 | 48 | 224 | -44.4% |
| 2023 | 86 | 238 | -21.0% |
| 2022 | 109 | 206 |
Source: SEC companyfacts cache [F1].
Capital returns and efficiency (annual)
| FY | Div ($mm) | Buybacks ($mm) | ROE% |
|---|---|---|---|
| 2025 | 98 | 37 | 7.0 |
| 2024 | 26 | 26 | 3.0 |
| 2023 | 32 | 2 | 5.3 |
| 2022 | 6 | 12 | 6.9 |
Source: SEC companyfacts cache [F1].
Note: Operating income YoY % omitted due to negative base year transition.
Key Operational Drivers Behind 2025’s Earnings Surge
According to the Q4 2025 earnings call transcript [N1] and Management Discussion & Analysis [S1],[S6], the surge in net income was primarily driven by improved demand dynamics across the hotel portfolio alongside operational efficiencies implemented throughout the year. Efficiency gains reportedly stemmed from targeted cost controls and asset management strategies focused on optimizing room occupancy rates and enhancing revenue per available room (RevPAR), although explicit metrics on RevPAR were not disclosed.
The company's refined portfolio mix and favorable market recovery conditions combined to accelerate top-line contributions, allowing margin expansion despite persistent sector cyclicality.
Addressing Legal Risks: Management’s Stance on Litigation Exposure
DiamondRock discloses ongoing exposure to routine litigation related to hotel operations and company matters but maintains a conservative view on the risk's financial impact [S4]. Management expresses confidence that liabilities exceeding insured amounts will not materially impair financial health or results due to robust insurance coverage frameworks.
While uncertainties remain inherent to legal proceedings’ outcomes, no material adverse effects are anticipated under current risk assessment protocols.
Investor Signals: Recent Q4 Results vs Wall Street Expectations
Q4 and full-year results modestly beat analyst expectations on both net income and Funds From Operations (FFO), highlighting quality cash flow generation relative to sector peers [N2],[N5]. The FFO metric—integral for hospitality REIT valuation—confirmed underlying strength in recurring earnings streams despite macroeconomic pressures.
Wall Street reactions included upgrades from institutions such as Deutsche Bank around early January, commending the dividend tax treatment clarity and capital return programs announced [N7],[N8]. This signals growing investor confidence tied to both operational performance and shareholder reward policies.
Capital Allocation Dynamics: Dividends, Buybacks, and Liquidity Position
Capital deployment balanced shareholder returns with financial prudence throughout fiscal year 2025:
- Dividends paid surged substantially to $98.3 million from $25.6 million in FY2024, demonstrating renewed commitment to distributions consistent with earnings growth [F1],[N7].
- Share repurchases accelerated notably with $37.1 million expended on buybacks versus $26 million prior year; these actions occurred amid liquidity comfort supported by $68 million cash reserves at year-end [F1],,,[S13],[S16],.
Taken together with an approximate ROE hovering near 7%, this allocation framework underscores a balanced approach optimizing return while managing leverage effectively within cyclical hospitality markets.
Free cash flow—calculated as operating cash flow less capex—stood around $136 million for the latest year based on available data on capex trends shifting modestly higher relative to previous periods [F1]. Capex increases reflect continued investments supporting property upkeep and selective enhancements rather than aggressive expansion.
Outlook and Growth Constraints: What the Company Signals for the Future
Although formal forward guidance is absent from recent disclosures, management commentary implies growth opportunities largely depend on maintaining optimized hotel operations aligned with prevailing market demand cycles [N1],[F1]. Headwinds notably include cyclical industry softness linked with economic variability and ongoing legal risk exposures requiring monitoring.
The emphasis remains on strategic portfolio management likely encompassing selective capital recycling or asset repositioning initiatives consistent with enhancing long-term value without compromising liquidity or dividend sustainability.
Metrics to Watch: Indicators for Sustainable Profitability
Given current disclosure limits, key indicators warranting close monitoring include:
- Continuation of positive operating income trajectories signaling durable profit conversion.
- Stability and growth of FFO streams indicating underlying cash flow health critical for sector valuations.
- Dividend coverage ratios ensuring distributions remain well-supported vis-à-vis net income and free cash flow generation.
- Market revPAR and occupancy trends reflecting demand conditions impacting revenue potential.
- Legal expense developments sustained within insured thresholds maintaining risk profile discipline.
Tracking these will provide clearer visibility into DiamondRock’s ability to sustain its recent rebound amidst sector volatility.
Summary Table: Historical Financial Performance Snapshot
| FY | Net Income (mn) | Operating Income (mn) | CFO (mn) | Dividends (mn) | Buybacks (mn) |
|---|---|---|---|---|---|
| 2025 | 101 | 244 | 98 | 37 | |
| 2024 | 48 | 224 | 26 | 26 | |
| 2023 | 86 | 238 | 32 | 2 | |
| 2022 | 109 | 206 | 6 | 12 |
This table consolidates DiamondRock Hospitality’s demonstrated financial rebound coupled with increasingly active capital returns through dividends and share repurchases reflective of strengthening fundamentals.
This analysis synthesizes publicly available financial statements, SEC filings, and earnings call disclosures without extrapolating beyond confirmed data points or issuing investment recommendations.
Disclaimer: This is research-only, informational analysis and not investment advice. It may include AI-generated interpretation and general industry context. Always verify important details using primary sources.
Comments