
Ferrellgas Partners: Analyzing Recent Financial Trajectory and Capital Structure Dynamics
Assessing Ferrellgas Partners’ financial volatility alongside its partnership restructuring reveals key insights into liquidity and investor returns.
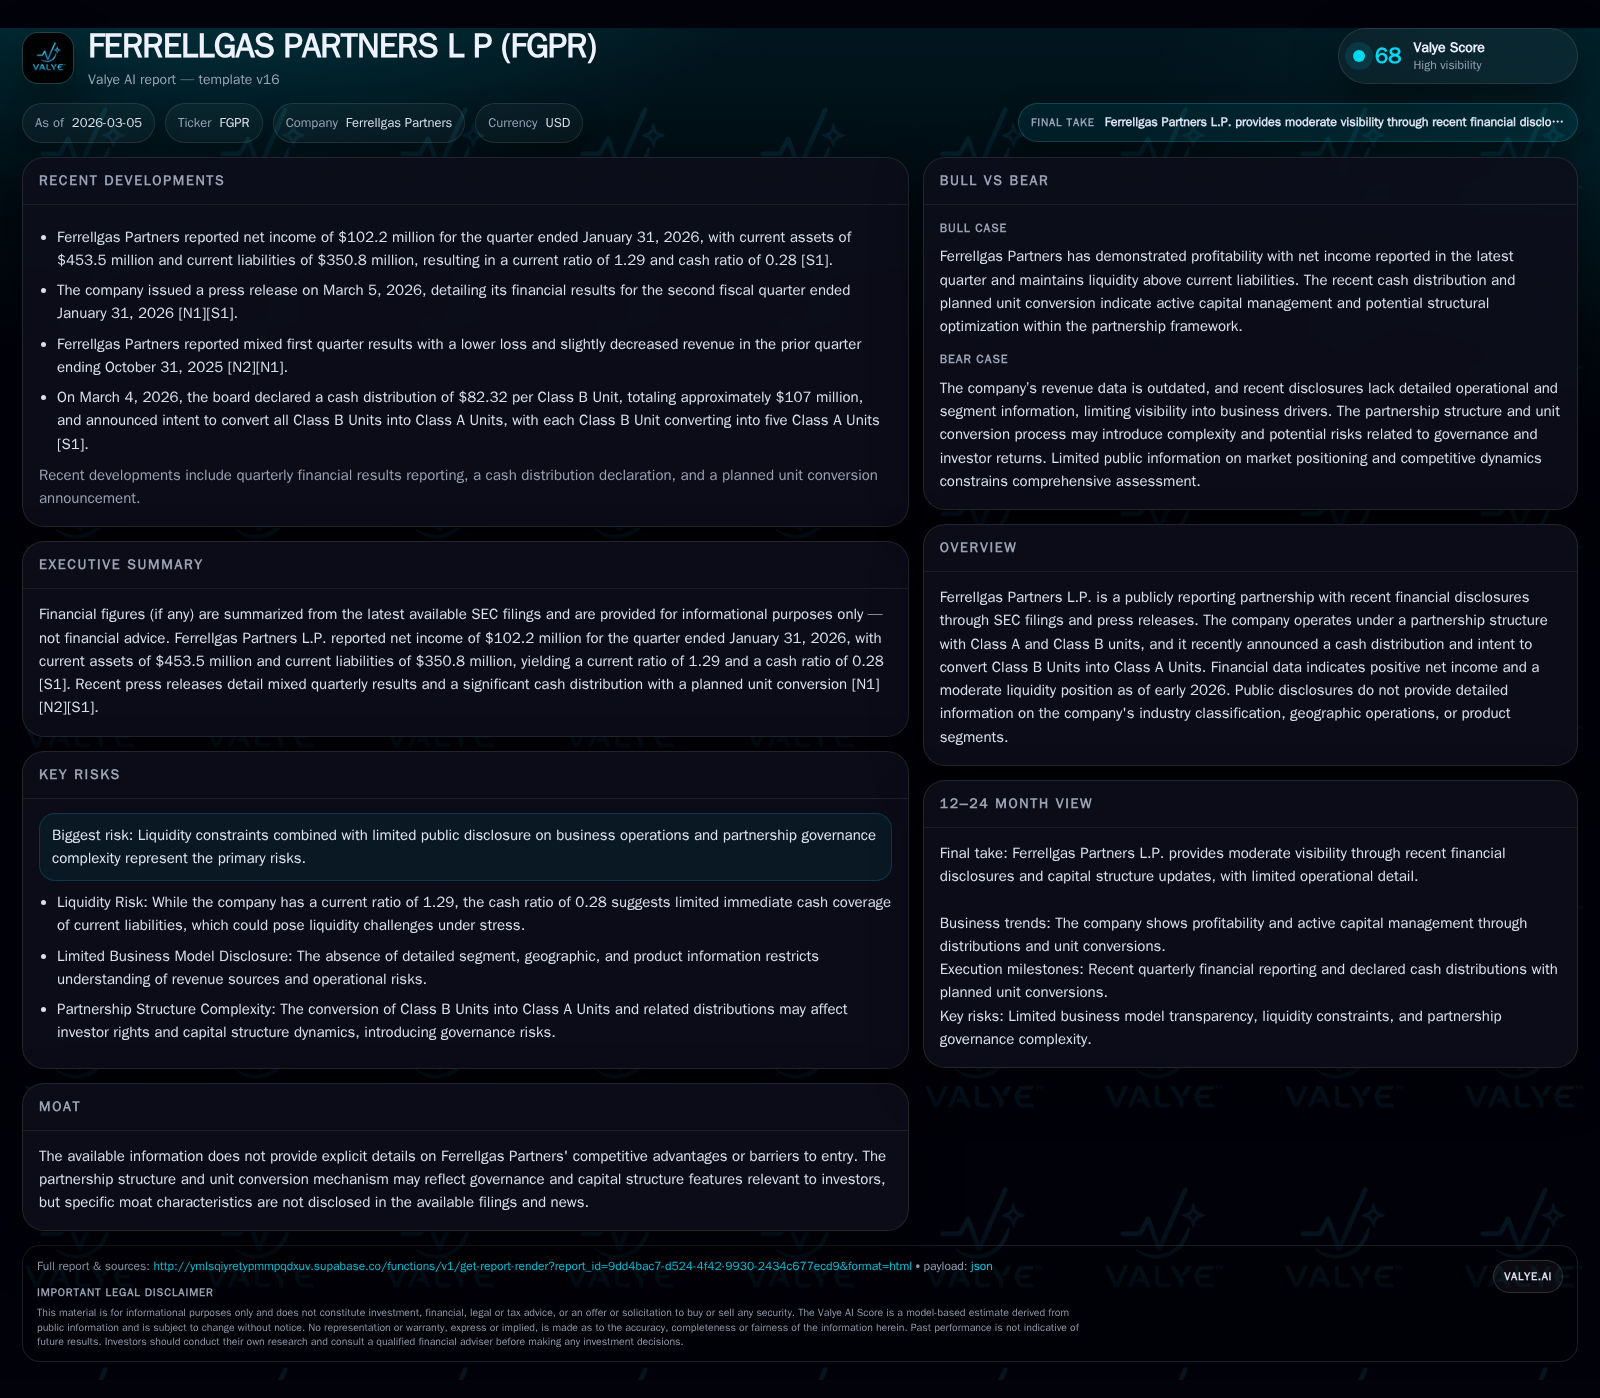
Ferrellgas Partners L.P. has exhibited fluctuating revenue and profitability over recent years, culminating in a marked decline in operating income and net income in FY2025, despite positive operating cash flow [F1]. The partnership's announced conversion of Class B units into Class A units in early 2026 signals notable changes in governance and capital distribution mechanics [N1],[S3],[S18]. Liquidity remains moderate with a current ratio near 1.29 and cash reserves around $96.9 million at the start of 2026, yet debt servicing pressures persist [F1],[S7],[S9]. The juxtaposition of declining earnings quality against stable cash flow and capital allocation through distributions highlights the nuanced operational challenges this partnership faces. Future disclosures and management commentary on liquidity management and unit conversion execution will be critical to monitor [N2],[S3].
Historical Revenue and Profit Fluctuations: Understanding Growth Drivers and Setbacks
Ferrellgas Partners has demonstrated fluctuating top-line performance over recent fiscal years, with revenue peaking at approximately $2.07 billion for fiscal year ending July 2018 [F1]. Prior to FY2018, revenue hovered close to $2 billion annually with minor year-over-year adjustments reflecting potentially volatile market conditions or operational shifts. Despite relatively stable revenues, operating income experienced notable volatility: after highs exceeding $245 million in FY2022, it declined sharply by over half (-56.1%) to about $90 million by FY2025 [F1].
This compression in operating profit accompanied a swing from sustained net income—above $147 million in FY2022—to a net loss of around $15.6 million reported in FY2025 [F1]. Such negative net results contrast with significant positive operating cash flows reaching approximately $136 million for FY2025, suggesting complexities in earnings quality related to non-cash charges or working capital variations common within capital-intensive sectors.
Capital expenditures rose moderately by roughly 13% in FY2025 compared to prior year levels, indicating ongoing investment but also adding pressure on free cash generation after operational expenses [F1]. This trend underscores challenges balancing maintenance and investment amid earnings instability.
Historical performance (annual)
| FY | Net ($mm) | CFO ($mm) | OpInc ($mm) | Capex ($mm) | Net YoY |
|---|---|---|---|---|---|
| 2025 | -16 | 136 | 90 | 80 | -114.1% |
| 2024 | 110 | 246 | 205 | 71 | -19.5% |
| 2023 | 137 | 212 | 234 | 89 | -7.5% |
| 2022 | 148 | 160 | 245 | 95 |
Source: SEC companyfacts cache [F1].
Capital returns and efficiency (annual)
| FY | FCF ($mm) |
|---|---|
| 2025 | 56 |
| 2024 | 175 |
| 2023 | 123 |
| 2022 | 65 |
Source: SEC companyfacts cache [F1].
Table: Historical Financial Performance Summary sourced from company filings [F1].
Quarterly updates reveal mixed net income growth as of Q2 fiscal year 2026 but tempered by persistent operational headwinds noted in recent press releases [N1], [N2], underscoring underlying volatility likely driven by external market conditions impacting propane-related operations.
Partnership Structure Changes: Implications of Unit Conversions on Governance and Capital
A key development is the board-approved intent to convert all outstanding Class B Units into Class A Units shortly after the March 2026 cash distribution payment [N1],[S18]. Upon reaching the "Class B Conversion Threshold," each Class B Unit converts into five Class A Units per the Partnership Agreement.
This conversion simplifies unit classes within the partnership and may alter control dynamics since Class A Units generally carry standard limited partner rights while Class B Units historically had different dividend or governance entitlements [N1],[S3],[S18]. The five-for-one ratio increases the number of units held by former Class B holders but redistributes economic interest among classes potentially impacting alignment between economic participation and voting power.
For investors accustomed to MLP-like structures where unit class bifurcation exists for tax or legacy reasons (e.g., incentive distribution rights), this conversion streamlines administrative complexity and may reflect confidence in stabilizing distributable cash flows sufficient for ongoing distributions post-conversion.
Monitoring impacts on per-unit distribution rates and earnings attribution among LP classes will be crucial for understanding future return dynamics under this partnership structure.
Liquidity Position and Debt Dynamics Through Early 2026
As of January 31st, 2026 Ferrellgas reported current assets totaling roughly $453 million against current liabilities near $351 million resulting in a current ratio around 1.29; cash & equivalents stood at about $96.9 million providing moderate liquidity buffer amid short-term obligations [F1],[S7],[S9].
SEC filings from December 2025 through early March 2026 detail ongoing debt maturities and financing activities indicating active management of credit facilities and covenant compliance across multiple financing entities ,[S13],,.
While liquidity coverage ratios currently support operational continuity without immediate distress signals, management focus appears directed toward optimizing capital structure through deleveraging or calibrated investment spending to mitigate margin pressures.
Given typical volatility inherent in propane supply/distribution sectors linked to weather or regulatory shifts these liquidity buffers are critical for risk mitigation.
Profitability Versus Operating Cash Flow: Discrepancies Indicate Earnings Quality Challenges
FY2025’s negative net income (-$15.57 million) contrasts with strong operating cash flow (~$136 million), highlighting significant non-cash adjustments such as impairments or deferred expenses along with working capital timing effects common among energy-sector partnerships managing inventory valuations or receivables/payables cycles.
This divergence requires cautious interpretation when assessing business health since robust cash flow supports liquidity whereas recurring accounting losses may signal structural margin compression or extraordinary charges needing validation through subsequent quarters.
In capital-intensive distributorships like propane wholesaling where distributable cash flow anchors valuation more than GAAP earnings this pattern is not uncommon but warrants monitoring given its implications for sustainable distributions available for limited partners.
Key Risk Factors From Recent SEC Filings: Regulatory and Operational Considerations
Recent risk disclosures highlight concerns including limited segment-level transparency hindering comprehensive analysis alongside litigation exposures typical for midstream energy firms subject to complex federal/state regulations governing storage/sales/distribution activities [S4],[S5].
Partnership governance complexity via unit class rights asymmetry before conversion completion adds operational risk alongside dependency on financing strategy execution amid volatile commodity prices limiting revenue predictability.
Limited public details on competitive positioning complicate moat assessment while exposing potential vulnerabilities related to market share or supplier/customer dynamics adjustments without public mitigation strategies.
Capital Allocation Strategies: Distributions Over Buybacks Reflect Partnership Norms
Ferrellgas Partners prioritizes steady cash distributions over equity repurchases; historical data shows absence of buyback programs since at least FY2018 confirming capital return chiefly via distributions aligned with partnership norms rather than C-corp practices [F1],[S18].
The March 2026 declared distribution approximates $107 million payable on Class B Units demonstrating commitment to returning capital consistent with unitholder expectations within available operational cash flow capacity ([N1],[S18]).
Capex has fluctuated near $80 million recently consistent with maintenance plus growth investments balanced against compressed free cash flow yielding an approximate FY2025 free cash flow near $56 million ([F1]).
No traditional ROE metrics are provided reflecting partnership focus on distributable cash flow yields rather than conventional equity returns reinforcing need for investors to evaluate returns via distributions versus retained earnings dynamics.
Outlook Considerations: Monitoring Conversion Execution and Liquidity Management
Analytical focus should center on progress regarding formal election and timing of Class B to Class A unit conversion affecting governance simplification and potential payout policy shifts ([N2],[S3],[S18]).
Key metrics include evolving liquidity ratios amid debt refinancing or repayments; normalization between net earnings trends versus operating cash flow reconciliation; capex plans reflecting strategic priorities; enhanced segment disclosure improving growth visibility.
Regulatory developments tied to operational permits or legal contingencies along with macro commodity price trends relevant to propane distribution remain material variables influencing future performance beyond currently disclosed data.
This analysis synthesizes publicly available financial data from SEC filings and market disclosures strictly avoiding speculative assumptions outside confirmed sources. It provides substantive insights into Ferrellgas Partners’ recent financial path underscored by partnership-unique factors affecting investor evaluation frameworks.
Disclaimer: This is research-only, informational analysis and not investment advice. It may include AI-generated interpretation and general industry context. Always verify important details using primary sources.
Comments