
Comfort Systems USA Strengthens Backlog and Cash Flow Amid Labor and Material Cost Pressures
Q2 2026 results highlight record revenue growth supported by geographic scale and diversified service mix in mechanical and electrical contracting.
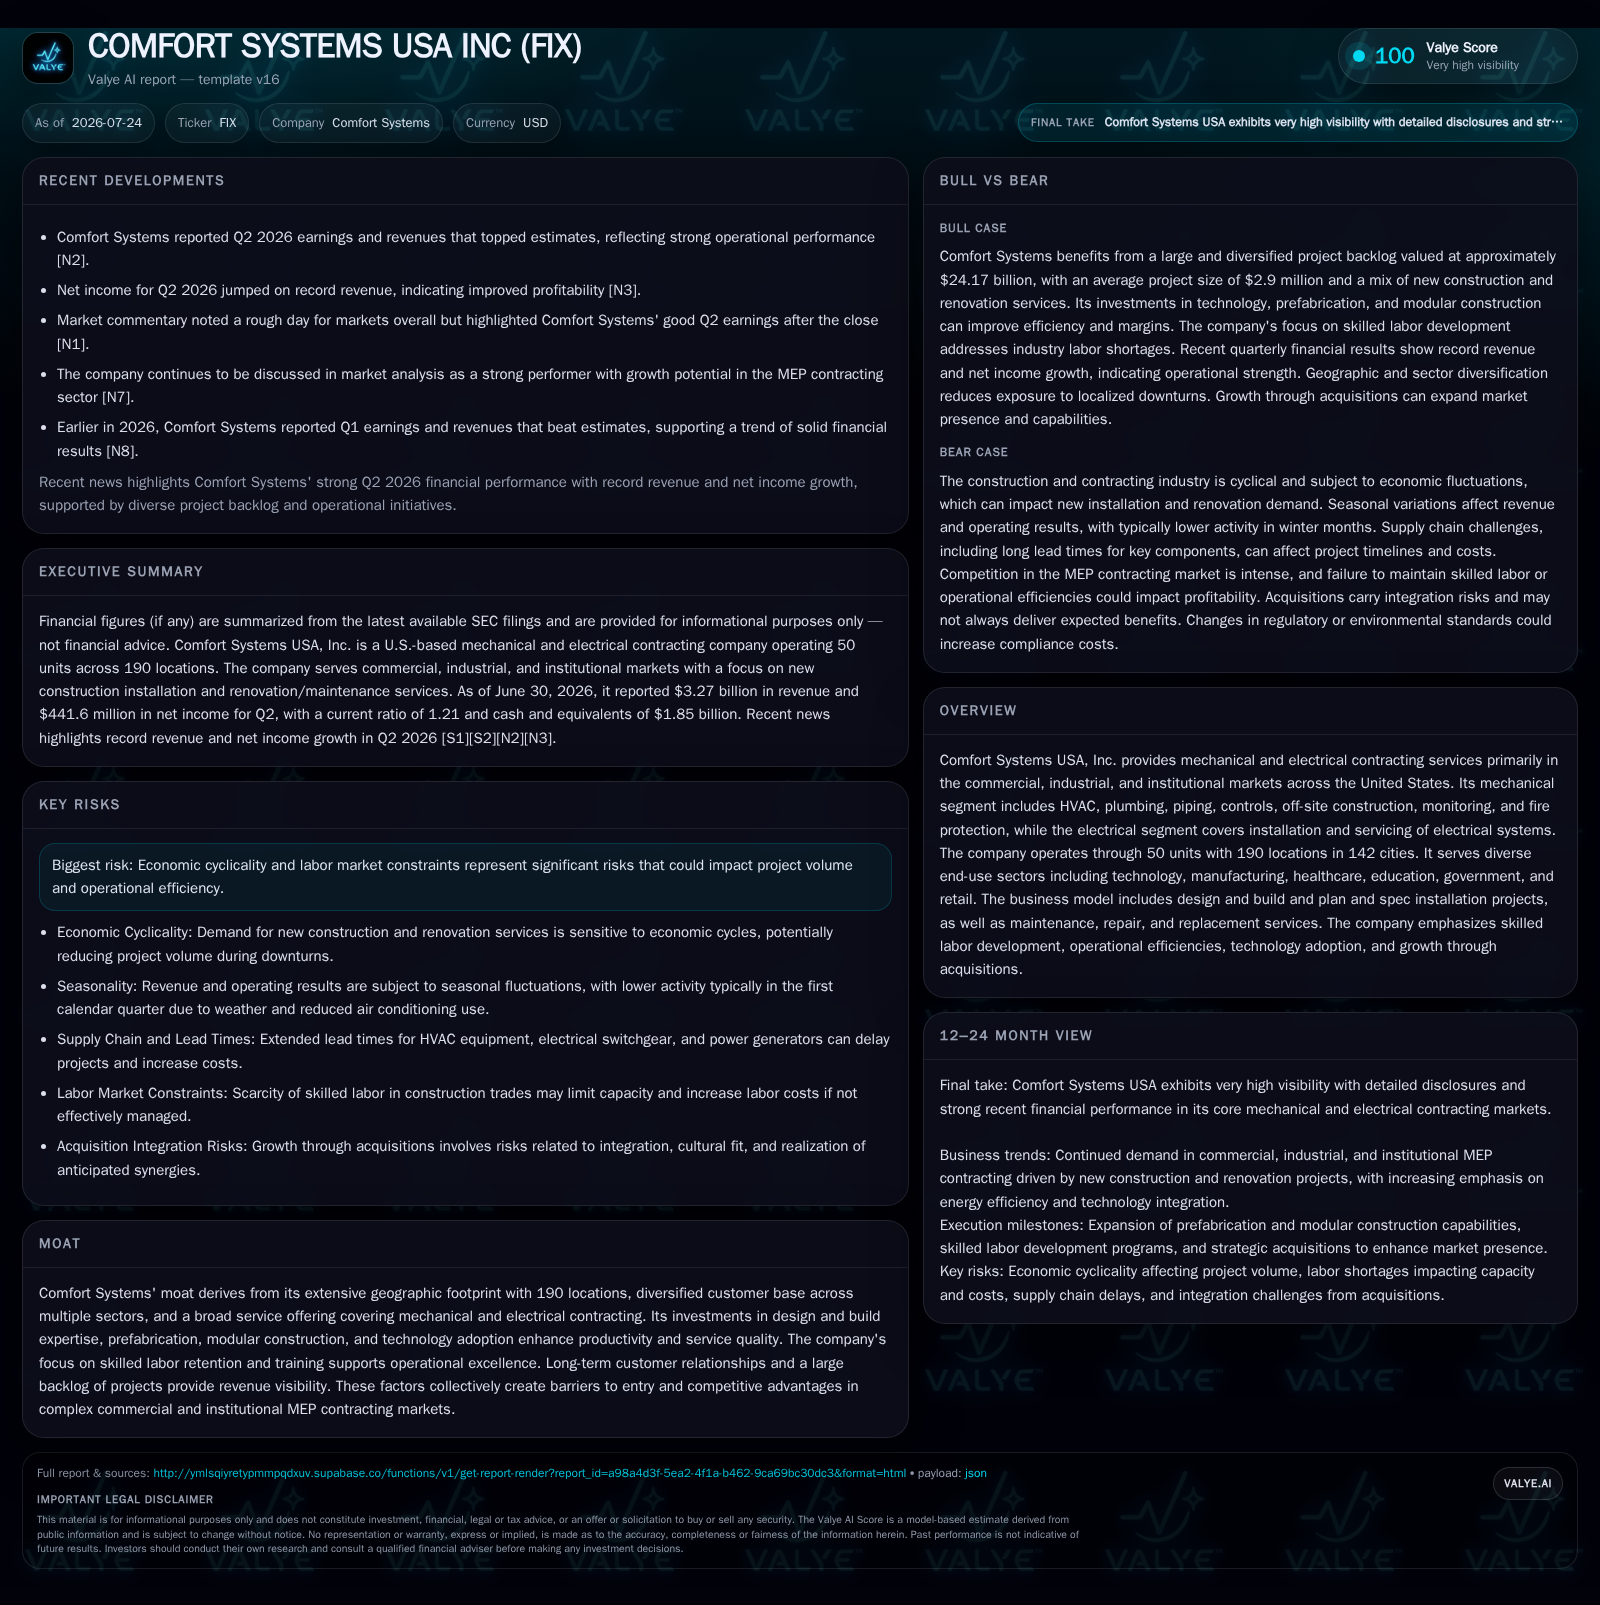
Comfort Systems USA continues to leverage its broad geographic footprint and multi-segment capabilities to deliver record project backlog and net income growth in Q2 2026. The company's cost-to-cost revenue recognition reflects operational discipline amid inflationary pressures on labor and materials. While economic cyclicality remains a risk, Comfort Systems’ emphasis on prefabrication, skilled labor retention, and technology adoption underpins its competitive moat. Continued execution of acquisitions alongside stable capital structure support outlook for sustained growth and cash flow generation.
Recent Operating Update
Comfort Systems USA reported an impressive second quarter of fiscal 2026 with net income surging to approximately $812 million, more than doubling the $400 million reported in the same period last year [S2][N3]. This sharp bottom-line improvement accompanied record revenue performance underpinned by substantial project backlog accumulated through a diversified portfolio of mechanical and electrical contracting services. The company’s revenue recognition adheres to a cost-to-cost input method calibrated to project completion progress, embodying practical judgment reflective of ongoing site conditions and incurred costs—a necessary adaptation in the MEP contracting sector due to the intricate nature of build cycles [S2].
Long-term visibility is fortified by a backlog valued at $24.17 billion as of December 31, 2025 across more than 8,400 active projects with average contract sizes around $2.9 million spanning six to nine months per project lifecycle [S1][S4]. Such scale supports operational planning while buffering against short-term cyclicality typical of the broader construction industry
Business Model: Multi-Service MEP Contracting with Geographic Scale
Comfort Systems operates through about 50 distinct units across 190 U.S. locations in 142 cities—a footprint that furnishes both regional market penetration and resource flexibility. This extensive coverage reduces exposure concentration risks and facilitates cross-utilization of engineering expertise, supervisory labor, and centralized prefabrication efficiencies [S1][S4]. Their business model centers on two primary service categories: mechanical systems predominately HVAC, plumbing, piping controls, off-site modular construction components, fire protection; and electrical systems installation and maintenance. Mechanical services contribute circa 73% of revenues while electrical accounts for roughly 27%, reflecting balanced diversification within the MEP ecosystem
Revenue streams emanate from several contract archetypes including design-build engagements where Comfort Systems works closely with clients from conception through installation; plan-and-spec contracts following established designs; as well as ongoing maintenance, repair, replacement (MRR) services in existing facilities [S1]. Approximately 63% of total revenues are from installation in new construction projects while the remainder comes from renovation or maintenance activities—service mixes that tend to provide recurring revenue inflows supporting margin stability during variable construction cycles
Industry Structure and Competitive Position
The mechanical and electrical contracting sector is materially fragmented but benefits companies like Comfort Systems that boast scale-enabled competitive moats. Smaller local contractors typically face capital constraints limiting geographic reach and service breadth. By contrast, Comfort Systems leverages purchasing power to secure better pricing on raw materials such as ductwork, pipe fittings, conduit wiring—costs comprising approximately 40-45% of project expenses—and bonds/insurance essential for project guarantees [S1][S4]
Moreover, the company actively invests in design excellence via advanced modeling capabilities alongside off-site prefab and modular construction methods that accelerate schedules while boosting quality control metrics. Skilled labor retention programs address a persistent industry-wide shortage exacerbated by cyclical demand spikes. These operational advantages promote higher labor utilization rates—a key gross margin lever in this labor-intensive industry—and improve project completion efficiency compared with peers reliant solely on on-site craftsmanship.
Customer bases span sectors including technology (largest share at 45%), manufacturing (22%), healthcare (9%), education (7%), government (5%), retail/restaurants/entertainment (4%), office buildings (5%), multi-family residential (1%) among others providing sectoral risk mitigation through diverse end-use demand profiles [S4][S22].
Growth Drivers
Long-term secular growth catalysts include population expansion fueling commercial/institutional space demand plus aging infrastructure necessitating modernization of increasingly complex HVAC/electrical systems that enhance energy efficiency and indoor air quality—trends accelerating retrofit activity especially in healthcare and education facilities.
Comfort Systems also pursues targeted acquisitions bolstering geographic reach or adding specialized capabilities which feed into backlog expansion while spreading fixed overheads more efficiently [S16]. Strategic deployment of digital project management tools complements these acquisitive efforts by enhancing bid accuracy helping reduce cost overruns—a material risk given fixed-price contracts prevalent in the sector [S1][S6]. Prefabrication adoption further drives productivity gains critical under labor constraints.
Finally, increasing environmental regulations incentivize building owners to replace legacy equipment with sustainable systems installed by expert contractors like Comfort Systems who maintain comprehensive service agreements locking in recurring revenue streams beyond initial installations.
Risks / Watchpoints / Growth Constraints
The company faces cyclical exposure linked to macroeconomic trends impacting construction volumes; downturns can delay contract awards extending receivable durations with collateral impacts on working capital given the heavy reliance on progress billing accounting methods [S1]. Inflationary labor cost pressures present margin headwinds particularly if raw material prices rise faster than indexed contract escalation clauses allow.
Subcontractor or supplier failures may generate delays or warranty claims increasing costs unexpectedly due to liquidity crunches in subcontracting markets—often intensified post-recessionally when smaller competitors fold or reduce capacity [S6]. Regulatory compliance risks exist relating to safety standards or wage/hours litigation although historical warranty claims have been immaterial which implies prudent operational governance.
Monitoring utilization rates amid uneven regional demand remains critical since underutilized skilled crews directly erode profitability in this business model heavily weighted toward direct labor costs [S6]. Finally, timing of new contract awards versus backlog consumption rates will dictate near-term revenue trajectories warranting close attention.
What to Watch Next
Investors should monitor Comfort Systems’ quarterly backlog updates relative to prior peaks reflecting execution momentum plus shifts between new installation versus maintenance segments for margin trend signals. Key milestones include integration outcomes from recent acquisitions announced or closed around Q2/Q3 periods that may drive incremental backlog additions.
Tracking commodity price trends against contractual pass-through mechanisms will reveal pricing power sustainability as well as any evolving credit metrics considering accounts receivable aging dynamics especially post-economic tightening phases. Additionally, quarterly reports often detail improvements or setbacks in prefabrication volume percentages which correlate strongly with operational leverage gains.
Guidance commentary around hiring plans for skilled technicians can serve as proxies for capacity expansion intentions or labor market stress indications.
Financial Profile Discussion
As of June 30, 2026, Comfort Systems maintains a strong liquidity position with cash and cash equivalents totaling approximately $1.85 billion complemented by current assets near $5.79 billion against current liabilities around $4.77 billion yielding a current ratio near 1.21—an acceptable short-term solvency indicator for the sector’s working capital intensive nature [F1]. Total debt is modest around $54 million long-term reflecting Net Debt significantly negative at approximately -$1.79 billion highlighting ample financial flexibility with no revolver borrowings outstanding at quarter-end while maintaining over $1 billion available borrowing capacity under credit facilities [F1][S9].
Robust operating cash flow generation evidenced by $1.53 billion provided through six months ended June reinforces internal funding ability supporting acquisitions ($163 million spent in Q2 alone), capex investments approaching $289 million focused on fleet/equipment upgrades alongside dividend increases sustaining shareholder returns consistent with prior payout progression policies [S16]
Comfort Systems’ financial profile thus aligns with strategic priorities emphasizing conservative leverage usage balanced against growth-oriented capital deployment optimizing long-term value generation potential.
This analysis is based on publicly available SEC filings dated through July 23, 2026 ([S1], [S2], [S3]) and financial statement data current as of June 30, 2026 ([F1]). It incorporates industry context specific to the mechanical and electrical contracting sector without providing investment advice.
Disclaimer: This is research-only, informational analysis and not investment advice. It may include AI-generated interpretation and general industry context. Always verify important details using primary sources.

Comments