
Flex LNG’s 2025 Profitability Declines Amid Stable Dividends and Strong Liquidity
Operating margins contracted in 2025 after prior gains, but liquidity and capital management remain robust.
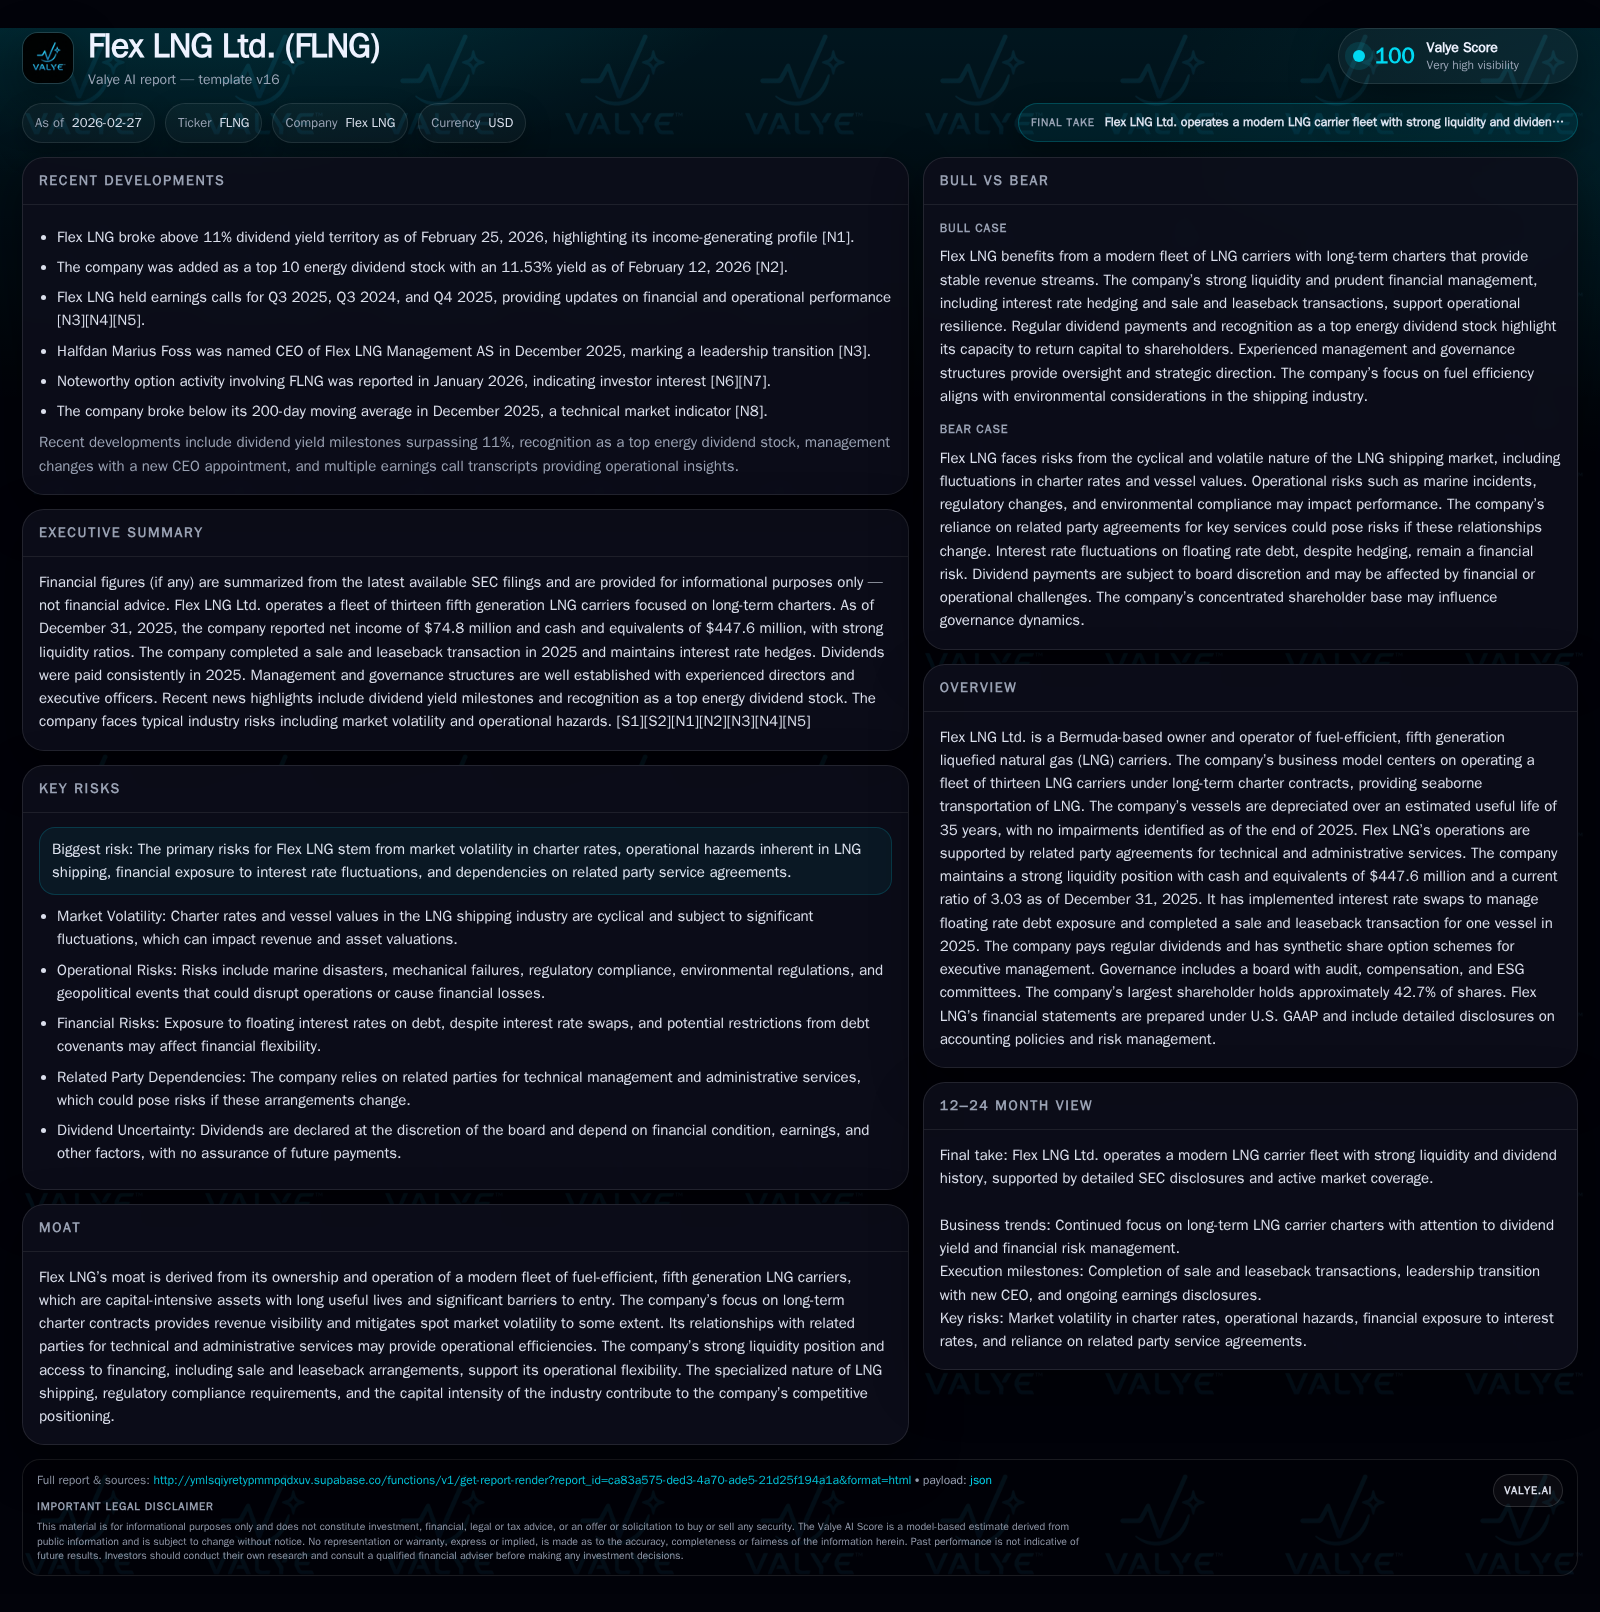
Flex LNG Ltd., a Bermuda-based owner of modern, fuel-efficient LNG carriers operating under long-term contracts, reported declining operating income and net income in 2025 relative to prior years, reflecting some market and operational pressures. Despite the profit contraction, the company maintained strong liquidity with a current ratio above 3.0 and ample cash reserves. Flex LNG continued its consistent dividend policy supported by cash flow from operations and employed sale-leaseback financing to optimize balance sheet flexibility. Interest rate exposure is actively managed through swaps. The key risks include exposure to volatile charter rates and floating debt costs, offset by the competitive advantage of its advanced fleet and secured contract portfolio.
Company Overview
Flex LNG Ltd., incorporated in Bermuda, owns and operates a fleet of thirteen modern fifth-generation liquefied natural gas carriers characterized by fuel efficiency and an estimated useful life of 35 years. The vessels are depreciated on a straight-line basis with separate consideration for vessel components and drydocking expenses. As of December 31, 2025, no vessel impairments were identified by management following regular assessments [S1], [F1]. The company benefits from long-term time-charter contracts that provide revenue stability during cyclical LNG shipping markets. Operational support is provided through related-party agreements offering advisory, technical management, administrative services, and compliance functions which streamline operations but introduce certain dependency risks [S19].
Historical Financial Performance
From 2022 through 2025, Flex LNG exhibited fluctuations in profitability as reflected in operating income, net income, operating cash flow (CFO), equity levels, and dividends paid:
Historical performance (annual)
| FY | Net ($mm) | CFO ($mm) | OpInc ($mm) | Net YoY |
|---|---|---|---|---|
| 2025 | 75 | 141 | 176 | -36.4% |
| 2024 | 118 | 183 | 198 | -2.0% |
| 2023 | 120 | 175 | 217 | -36.2% |
| 2022 | 188 | 220 | 201 |
Source: SEC companyfacts cache [F1].
Capital returns and efficiency (annual)
| FY | Div ($mm) | Buybacks | ROE% |
|---|---|---|---|
| 2025 | 162 | 10.4 | |
| 2024 | 162 | 14.6 | |
| 2023 | 181 | 0 | 14.2 |
| 2022 | 186 | 0 | 20.7 |
Source: SEC companyfacts cache [F1].
Note: Operating income serves as a proxy for revenue due to limited top-line disclosure.
The data indicate an operating income decline of approximately 11% from fiscal year 2024 to fiscal year 2025 and a sharper net income decrease of about 36%, suggesting increased pressures possibly from financing costs or other non-operational factors impacting profitability [F1]. Operating cash flow contracted by around 23%, partly influenced by cyclical drydocking costs inherent in this capital-intensive industry segment [F1], [S24]. Equity has declined steadily over this period consistent with reduced retained earnings amid dividend distributions.
Growth Prospects
Flex LNG's growth strategy currently emphasizes capital-light initiatives such as sale-leaseback transactions that enhance liquidity without immediate capital expenditure for fleet expansion or newbuilds, supporting selective investments or debt management while sustaining shareholder returns [S8], [S21]. Long-term charter contracts underpin predictable cash flows reducing exposure to spot market volatility typical in LNG shipping driven by global energy demand shifts.
The fleet size remains steady at thirteen vessels with no disclosed plans for immediate expansion or acquisitions; regulatory developments tightening emissions standards globally may necessitate future capital investments or retrofits that could affect cost structures despite the fuel-efficient design of the current fleet generation.
Financial Outlook & Key Milestones
Dividends have been declared consistently at $0.75 per share quarterly throughout FY25 amounting to roughly $162 million annually, reflecting management's confidence in sustained operational cash flows despite earnings pressure [S3], [S15]. Key upcoming operational milestones include scheduled vessel drydockings mandated for regulatory compliance; these are more frequent than prior periods but have not triggered asset impairments as per latest impairment assessments [S23], [S24].
Refinancing risks linked to loan maturities clustered in the near future warrant monitoring as all financial covenants have been met through mid-2025 but cross-default provisions remain a potential vulnerability in adverse scenarios [S9], [S20].
Capital Allocation & Returns
The company balances shareholder distributions with prudent liquidity maintenance evidenced by over $448 million in cash and equivalents at year-end FY25 alongside a strong current ratio exceeding three times current liabilities—a signifier of solid short-term financial health supporting resilience against market fluctuations [F1], [S4].
Interest rate swaps hedge approximately $775 million of variable-rate debt at an average fixed rate near the mid-2% range mitigating exposure to rising SOFR-based borrowing costs; however, significant floating rate debt (~$955 million) remains subject to interest rate variability impacting future financing expenses [S4], [S6], [S8].
No recent share repurchases have occurred; treasury shares held are modest at roughly 428 thousand shares representing less than one percent of outstanding shares indicating a focus on dividend continuity over buybacks given prevailing market conditions and capital needs associated with maintenance cycles including drydockings.
Return on equity based on latest annual net income relative to equity is approximately 10.4%, reflecting moderate profitability consistent with capital-intensive shipping sector norms where long asset depreciation horizons temper returns compared with other industries [F1].
Industry Positioning & Competitive Advantages
Flex LNG benefits from a modern fleet offering enhanced fuel efficiency critical amid increasingly stringent environmental regulations targeting emissions reductions within maritime logistics globally—a competitive advantage relative to older fleets facing accelerated obsolescence risks under evolving IMO Tier III standards.
Its portfolio of long-term charter contracts provides insulation against short-term market volatility tied to fluctuating natural gas prices and regional demand-supply imbalances affecting spot charter rates typical in LNG shipping markets.
Operational services outsourced largely via related-party agreements deliver cost efficiencies but require ongoing oversight due to associated governance dependencies.
Risk Factors
Key risks include volatility in charter rates driven by global energy demand shifts; exposure to floating interest rates despite hedging efforts especially upon maturity or non-renewal of swaps; operational hazards such as accidents or forced downtime impacting revenues; liquidity constraints tied to leverage levels plus potential loan covenant breaches posing refinancing risks; reliance on affiliated service providers potentially complicating governance dynamics; minor foreign currency exposures due to overhead costs denominated mainly in GBP and NOK without formal hedging; inflationary pressures elevating operating costs potentially compressing margins unless offset contractually; and standard legal/regulatory risks inherent to international maritime transportation requiring vigilance and mitigation strategies.
Outlook & Investor Considerations
Absent explicit forward guidance beyond dividend declarations, investor attention should focus on quarterly earnings releases for signals regarding charter contract renewals or newbuild orders which would indicate shifts toward growth beyond maintenance capital expenditures.
Monitoring effectiveness of interest rate hedging strategies amidst changing monetary policies impacting SOFR levels is critical given Flex LNG’s substantial variable-rate debt exposure.
Geopolitical developments influencing global LNG trade patterns—especially shifting demand centers between Europe and Asia-Pacific—could materially affect vessel utilization rates and charter economics.
Management commentary on refinancing approaches addressing upcoming maturities will also be pivotal for assessing balance sheet flexibility and dividend sustainability.
Conclusion
Flex LNG Ltd.'s performance through fiscal year ending December 31, 2025 highlights challenges in sustaining profitability amid fluctuating charter markets and increasing financing costs within the capital-intensive LNG shipping sector while demonstrating disciplined liquidity management via robust cash reserves and effective financial hedging instruments. Its modern fleet underpinned by long-term charters establishes a competitive moat tempered by requisite vigilant risk management around interest rates, operational exposures, regulatory compliance, and refinancing dynamics. Dividend consistency underscores management confidence though future growth depends on navigating macroeconomic uncertainties affecting LNG trade alongside strategic capital deployment decisions.
Disclaimer: This report summarizes publicly available information as of February 27, 2026 solely for informational purposes and does not constitute investment advice.
Disclaimer: This is research-only, informational analysis and not investment advice. It may include AI-generated interpretation and general industry context. Always verify important details using primary sources.
Comments