
H.B. Fuller: Pricing Power, Restructuring, and the Battle for Adhesive Market Share
H.B. Fuller’s recent earnings show margin expansion driven by pricing and restructuring, but competitive intensity, raw material volatility, and shareholder activism complicate its long-term value equation. The company’s ability to translate global scale and R&D into sustainable economic advantage will determine whether it can outpace rivals and justify its strategic direction.
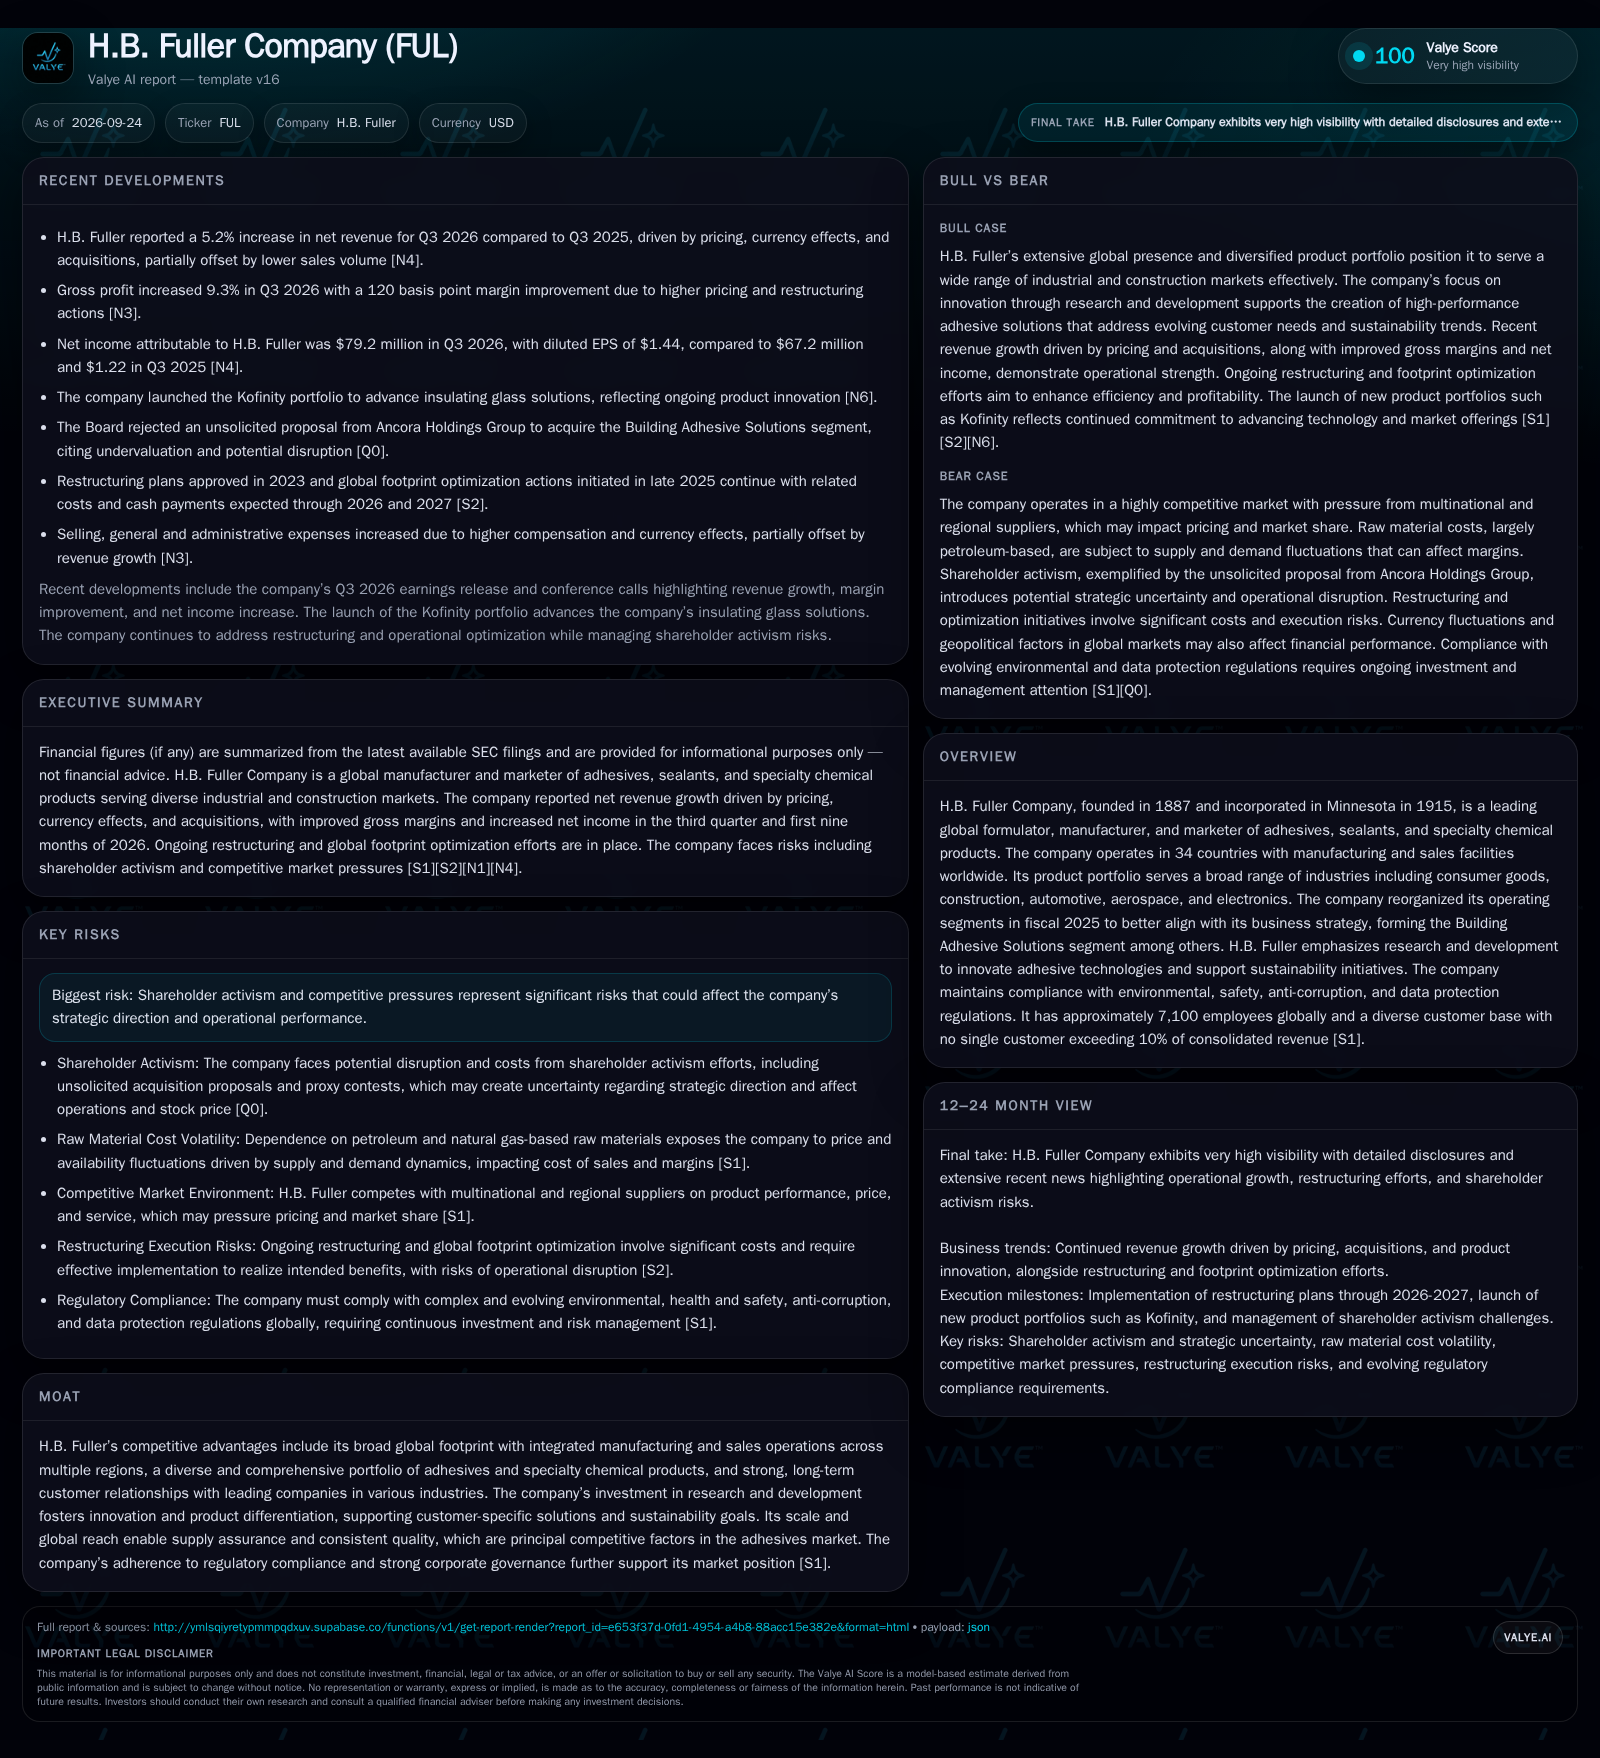
H.B. Fuller posted a 5.2% YoY revenue increase and a 120-bps gross margin improvement in Q3 2026, achieved mainly through price hikes and restructuring, despite a decline in sales volume. The company’s global scale, diversified customer base, and ongoing R&D investments could underpin future gains, but margin sustainability is threatened by raw material cost swings and fierce competition. Shareholder activism, including a rejected segment buyout proposal, underscores strategic uncertainty. Monitoring volume trends, restructuring execution, and raw material costs will be key to evaluating Fuller’s trajectory. [S2]
H.B. Fuller’s latest quarter demonstrates the company’s ability to drive earnings through assertive pricing and operational restructuring, even as underlying sales volumes soften. The adhesives giant is attempting to leverage its global footprint, broad product portfolio, and R&D-led innovation to offset cost pressures and defend margins in a fiercely competitive, input-sensitive industry. However, with shareholder activism on the rise and execution risks mounting, the company’s path forward hinges on its capacity to balance efficiency gains with sustainable volume growth and market share defense.
Recent Margin Expansion and Strategic Tensions Define the Current Moment
In the third quarter of 2026, H.B. Fuller reported a 5.2% year-over-year increase in net revenue, reaching $938.2 million. This growth was driven by a substantial 7.4% increase in pricing, which more than offset a 3.0% decline in sales volume. Gross profit rose 9.3% to $311.7 million, with gross margin expanding by 120 basis points as a result of higher prices and restructuring actions. However, selling, general, and administrative expenses climbed 13.4%, primarily due to increased compensation and negative currency effects. The company is in the midst of a multi-year global restructuring and footprint optimization program, with related costs expected into 2027. Meanwhile, strategic uncertainty has been heightened by a rejected unsolicited offer from Ancora Holdings Group to acquire Fuller’s Building Adhesive Solutions segment, reflecting active shareholder engagement and debate over the company’s direction. [S2]
How Pricing, Volume, and Cost Structure Shape Fuller’s Profit Model
H.B. Fuller’s core business economics are shaped by the interplay between pricing power, volume leverage, and volatile input costs. The company primarily generates revenue through the sale of industrial adhesives and specialty chemicals to a highly diversified customer base, with no single client accounting for more than 10% of revenue. This diversification provides some revenue stability, but volume growth remains sensitive to end-market conditions in construction, consumer goods, and manufacturing.
Recent results highlight that Fuller has been able to drive top-line growth through price increases, compensating for declining volumes. This pricing discipline, combined with restructuring and footprint optimization, has contributed to improved gross margins. However, the cost structure is heavily influenced by petroleum-based raw materials—tackifying resins, polymers, and plasticizers—whose prices can fluctuate sharply with global supply-demand dynamics. Operating leverage is achieved when volume growth outpaces fixed manufacturing costs, but rising SG&A expenses and restructuring outlays can dilute earnings if not offset by sustainable gains in margin or scale.
The capital intensity of the business is moderate: manufacturing and distribution require ongoing investment, but R&D-driven innovation and supply chain optimization are key levers for value creation. The company reported cash and liquidity metrics for the period; these figures do not by themselves establish operating runway, investment capacity, financial flexibility, or financing capacity. [S2]
Competing for Adhesive Leadership: Global Scale versus Local Rivals
H.B. Fuller competes in a fragmented global adhesives market against both multinational giants and agile regional suppliers. Key competitive factors include product performance, technical support, supply reliability, price, and customer service. Fuller’s global manufacturing footprint and broad product portfolio—spanning consumer goods, construction, automotive, and industrial applications—enable it to serve large, diversified customers with complex needs.
The company’s emphasis on R&D-driven innovation and sustainability may help differentiate its offerings, particularly as regulatory and customer demands evolve. Yet, barriers to entry in core adhesive segments are moderate; switching costs for customers can be meaningful in high-specification or mission-critical applications but are lower in commoditized categories. Regional competitors may undercut on price or offer faster customization, while global peers can match Fuller’s scale and technology.
The recently reorganized Building Adhesive Solutions segment consolidates related businesses to better align with market opportunities, but also spotlights the segment’s strategic value—evidenced by external interest from activist investors. Whether Fuller can sustain a competitive edge will likely depend on continued innovation, supply chain resilience, and the ability to balance price with volume retention.
Sustained Pricing Power and R&D Innovation Drive Profitable Growth
If H.B. Fuller can maintain its recent pricing momentum while stabilizing or growing sales volumes, the company could deliver sustained gross margin expansion and higher earnings. Successful execution of restructuring and footprint optimization could further improve cost efficiency, while ongoing R&D investments may yield differentiated products that command premium pricing or open new markets—particularly in high-growth sectors like sustainable construction or advanced manufacturing.
Evidence supporting this scenario would include continued gross margin improvements above historical averages, volume stabilization or growth in key end-markets, and successful commercialization of new products such as those in the Kofinity portfolio. Customer win announcements, expanding market share in targeted applications, and declining SG&A as a percentage of sales (post-restructuring) would further confirm the thesis.
Margin Gains Offset Volume Pressure, but Competitive Intensity Limits Outperformance
The most plausible trajectory is that H.B. Fuller sustains modest revenue growth driven primarily by pricing actions and incremental product innovation, while sales volumes remain pressured by macroeconomic headwinds and competitive market share battles. Gross margins remain above pre-restructuring levels, but incremental gains become harder to achieve as competitors respond with their own pricing and R&D strategies.
Restructuring delivers cost benefits, but elevated SG&A and periodic raw material cost spikes periodically offset operating leverage. The company continues to generate positive net income and maintains a stable, if unspectacular, liquidity profile. Shareholder activism or strategic alternatives remain a background risk, but the board resists major divestitures absent compelling value. Confirmation would come from stable or slightly increasing margins, steady cash generation, and limited volume erosion; a reversal in any of these metrics would challenge the base view.
Input Cost Shocks and Volume Declines Erode Margin Gains
In a negative scenario, H.B. Fuller’s pricing power proves transitory as competitors undercut and customers push back, leading to a renewed decline in sales volumes. Simultaneously, raw material costs spike due to supply disruptions or energy price shocks, compressing gross margins and eroding the gains achieved through restructuring.
Execution missteps—such as delayed restructuring, integration failures, or R&D investments that fail to yield commercial products—amplify cost pressures. Shareholder activism escalates, creating management distraction or forcing suboptimal strategic moves. Evidence for this scenario would include falling gross margins, rising SG&A as a share of sales, persistent volume declines, and any sign of covenant or liquidity stress.
Milestones That Will Clarify H.B. Fuller’s Margin and Growth Trajectory
Monitor quarterly gross margin trends for evidence of sustained pricing power and cost discipline.
Track sales volume changes across major end-markets—especially construction and consumer goods—to gauge demand resilience.
Watch progress and cost realization from restructuring and footprint optimization programs; delays or overruns would be a warning sign.
Assess SG&A expenses as a percentage of revenue for signs of operating leverage or cost creep.
Observe raw material cost trends and the company’s ability to pass through input price increases.
Scrutinize new product launches and their commercial uptake, with a focus on R&D-driven differentiation (such as the Kofinity portfolio, if disclosed).
Follow any developments in shareholder activism or strategic alternatives, including potential asset sales or board changes.
Evaluate liquidity and working capital metrics for early signs of financial stress, especially if volume or margin trends deteriorate.
Disclaimer: This is research-only, informational analysis and not investment advice. It may include AI-generated interpretation and general industry context. Always verify important details using primary sources.

Comments