
GlobalFoundries’ Single-Sourced Strategy and Geographic Diversification Support Modest Growth Amid Cyclical Recovery
GlobalFoundries returned to profitability in 2025 driven by design wins and operational efficiencies, yet growth faces semiconductor cyclicality and customer concentration challenges.
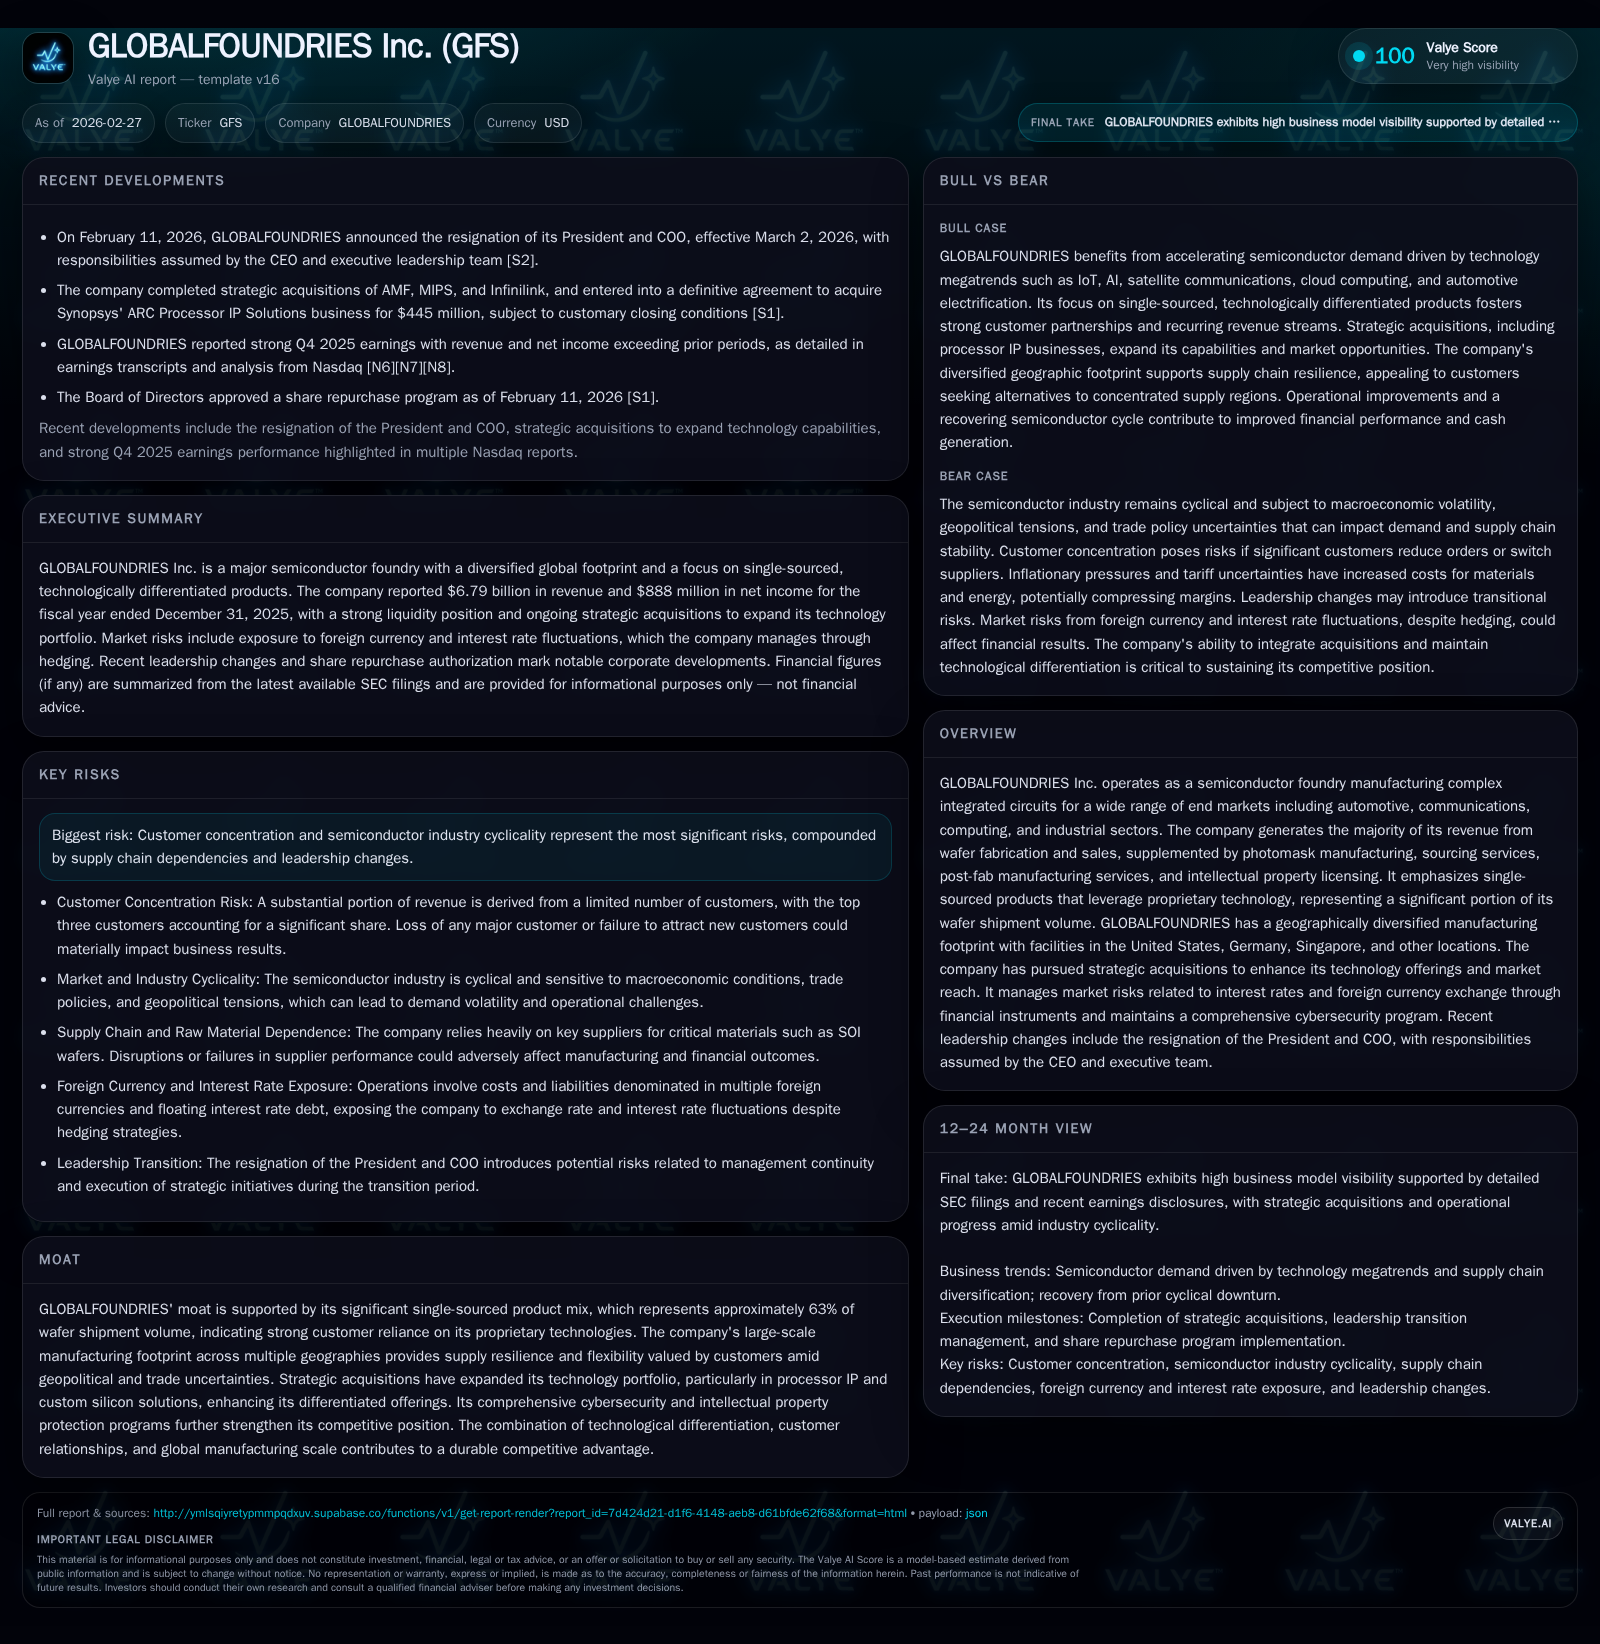
In 2025, GlobalFoundries (GFS) navigated the semiconductor industry’s gradual recovery from inventory corrections, achieving stable revenue and a significant net income rebound following prior losses. The company’s moat rests on a high proportion of single-sourced wafer products and a geographically dispersed manufacturing footprint that enhances supply resilience amid geopolitical tensions. Recent acquisitions expanded technology offerings, while capital discipline and steady R&D investments underscore its commitment to differentiated solutions. Looking forward, semiconductor demand normalization and design wins underpin modest growth prospects, although historical cyclicality, concentrated customer relationships, and cost pressures warrant close monitoring.
Company Overview and Business Model
GlobalFoundries Inc. operates as a leading semiconductor foundry specializing in fabricating complex integrated circuits utilized across automotive, communications, computing, and industrial markets. Its primary revenue source is wafer fabrication, representing roughly 89% of net revenue in 2025 [S1]. Complementary revenues stem from photomask manufacturing, non-recurring engineering services, sourcing services, post-fab manufacturing processes, and IP licensing.
The company leverages its extensive global manufacturing presence with fabs located principally in the U.S., Germany, Singapore, and additional sites worldwide to provide supply chain resilience in an increasingly geopolitical-sensitive environment [S1][S7]. This geographic diversity supports customer demand for non-China/non-Taiwan supply options during export control pressures.
A crucial competitive advantage is GlobalFoundries’ single-sourced product mix which accounted for approximately 63% of wafer shipment volume in 2025 [S1]. This implies that many customers rely exclusively on GlobalFoundries’ proprietary technology for mission-critical applications that cannot be readily replicated or dual-sourced without significant redesigns.
Strategic acquisitions completed during the year—including Advanced Micro Foundry (AMF), MIPS Technologies, and Infinilink—expanded GF's processor intellectual property portfolio and custom silicon solutions capabilities. These moves bolster the company’s ability to offer differentiated products beyond standard foundry services [S1].
Historical Financial Performance
The semiconductor industry endured a cyclical downturn through the previous two years leading up to 2025 due to excess inventory levels held by customers across various end markets. In response, customers significantly drew down inventories during 2025 resulting in subdued but stabilizing demand conditions globally [S1].
Historical performance (annual)
| FY | Rev ($bn) | Net ($mm) | Rev YoY | Net YoY |
|---|---|---|---|---|
| 2025 | 6.8 | 888 | +0.6% | +438.9% |
| 2024 | 6.8 | -262 | -8.7% | -125.7% |
| 2023 | 7.4 | 1018 | -8.8% | -29.6% |
| 2022 | 8.1 | 1446 |
Source: SEC companyfacts cache [F1].
Capital returns and efficiency (annual)
| FY | ROE% |
|---|---|
| 2025 | 7.4 |
| 2024 | -2.4 |
| 2023 | 9.1 |
| 2022 | 14.5 |
Source: SEC companyfacts cache [F1].
Note: Revenue growth reflects industry cyclicality with recoveries starting in late 2024/early 2025 while net income volatility includes a swing from losses to substantial profits as operational leverage improved [F1].
In terms of profitability metrics based on reported data for full-year 2025, net income rebounded sharply to $888 million versus a loss of $262 million in the prior year period—a nearly fivefold improvement resulting from improved shipment utilization (86% in FY25 vs. 77% FY24) and cost efficiency gains partially offset by pricing pressure on average selling prices (ASPs) [S5][S11][F1]. This drove a return on equity of approximately 7.4%, indicating modest but positive returns on shareholder capital deployed [F1].
Gross margins modestly increased by about 40 basis points to just under 25%, reflecting improved factory loading efficiencies alongside some unfavorable ASP movements and reduced capacity reservation fees from customers [S5]. R&D spending rose roughly by $22 million (+4.4%) reaching $518 million or approximately 7.6% of net revenue as management invests consistently into differentiated process technologies aligned with strategic priorities focused away from lowest nanometer nodes toward specialized IP portfolios [S5][S14].
Capital expenditures including purchases for property plant & equipment rose year-over-year supported partly by government grants totaling $315 million received primarily from Singapore and U.S. programs aimed at supporting fab infrastructure expansion and innovation investments [S6][S12].
Debt profile also improved materially given early prepayment of outstanding term loan facilities reducing total interest-bearing loans from $1.81 billion at Dec-24 to about $1.15 billion at Dec-25 with revolver availability intact at around $1 billion providing ample liquidity buffer beyond cash & equivalents of nearly $1.81 billion on balance sheet end-2025 [S6][S8][F1].
Future Growth Prospects
GlobalFoundries’ growth trajectory will hinge on several company-specific levers intertwined with broader semiconductor market dynamics:
Design Wins: The record number of design wins achieved during 2025 reflects strong engagement with existing customers as well as penetration into new accounts leveraging its technology differentiation especially in AI-enabled edge devices, automotive electrification sensors/modules including autonomous driving silicon requirements [N2][N3][S1].
Single-Sourced Products: Sustaining the approximate two-thirds share of single-source wafer shipments is expected to underpin steady revenue streams as these products are mission-critical with higher switching barriers for customers emphasizing product performance and supply security over commodity sourcing decisions [S1].
Geographic Manufacturing Footprint: The company’s strategy to emphasize non-China/Taiwan suppliers addresses emerging geopolitical realities where procurement diversification is valued by OEMs seeking risk mitigation against export control disruptions or trade restrictions—a competitive advantage over less diversified peers [S1].
Technology Portfolio Expansion: Continued integration of acquired IP assets such as MIPS’s processor architectures combined with internal R&D efforts focusing on specialized platforms promises incremental revenue contribution beyond traditional foundry service offerings bolstered by long-term agreements secured with major clients valued at approximately $11 billion in committed future revenue/payment streams as of latest disclosures [S11][N2].
Government Grants: Potential further support through government funding programs related to semiconductor fab investment incentives could reduce capex burdens or support R&D initiatives enhancing future competitiveness especially within U.S., Singapore government schemes already demonstrated materially contributing in latest fiscal year cash inflows [S6][N13].
On the flip side risks include ongoing semiconductor industry cyclicality manifesting as uneven demand across consumer-facing markets (whose inventories remain somewhat elevated), concentrated customer exposure where three top buyers accounted for over ~40% wafer revenue mix posing dependency risk if any large contract terms shift unfavorably; raw material supply chain fragilities; energy price inflation impacting fab operating costs; plus potential leadership transition effects following announced executive-level succession effective March ’26 which could influence strategic execution momentum despite stated continuity plans under CEO Tim Breen leadership team stewardship [N2][N3][S24].
Forecasts & Key Milestones To Monitor (Analysis)
Although there is no explicit multi-year financial guidance publicly disclosed yet for post-FY25 periods,[N2] notable metrics worth tracking include:
- Quarterly shipment utilization trends given their direct leverage impact on margins.
- Progression of design wins converted into volume production orders.
- Pricing dynamics amidst competitive foundry landscape evolution including relative ASP movements.
- Operational cost trends especially utilities/materials inflation adjusting gross margin expectations.
- Development milestones integrating acquired IP platforms MIPS/Infinilink into scalable product lines.
- Capital deployment patterns balancing capex intensity versus free cash flow generation.
- Customer concentration shifts potentially altering risk profile.
- Government grant receipts which could materially influence capex funding needs or operational subsidy.
- Any updates related to the company's R&D focus recalibrations or new technology platform announcements.
Capital Returns & Allocation Priorities
Currently GlobalFoundries does not pay dividends nor has it indicated imminent plans for dividend initiation which is consistent with capital-intensive peers reinvesting cash flows into fab expansions and R&D to drive future growth rather than returning capital directly to shareholders via distributions at this stage [S24][F1].
Free cash flow details are not fully detailed,[F1] however operating improvements signaled by strong net returns suggest improving internal funding capacity for organic growth plus selective acquisition strategies demonstrated by recent purchases costing ~$613 million paid during FY25 alongside tooling/plant upgrades.[S12]
Debt reduction efforts notably through early prepayment of legacy term loans indicate conservative financial management aimed at lowering interest expense burden and increasing balance sheet flexibility while maintaining undrawn revolver access exceeding $1 billion provides cushion against volatility or opportunistic investments.[S6][S9]
Research investment remains steady around ~7–8% of revenues signaling commitment toward sustaining technology differentiation which underpins GlobalFoundries' single-source customer relationships matrix.[S14]
Overall allocation appears focused on balancing capex/R&D investment for mid- to long-term differentiation versus strengthening financial flexibility without shareholder payout initiatives currently evident.
Industry Context Analysis (Uncited General Analysis)
The foundry business faces intensifying competition from giants like TSMC who retain dominant scale in sub-10nm nodes at premium margins approaching or exceeding ~60% gross margin levels driven by advanced logic processes.[N1] GlobalFoundries has deliberately exited aggressively scaling down nodes under ~12nm focusing instead on differentiated specialty processes serving automotive/IoT/communications niches demanding reliability over bleeding-edge density.[N2] This focus mitigates direct head-on competition but also limits ultimate addressable market size relative to TSMC or Samsung’s advanced node dominance. Supply chain localization trends plus rising geopolitical trade friction incentivize fab operators maintaining multi-region presence aligning well with GlobalFoundries’ footprint strategy. Customer consolidation is another ongoing theme exacerbating concentration risks among foundries though it also enables stronger LTAs securing more predictable volumes albeit at pricing tradeoffs. Semiconductor industry cyclicality remains a defining characteristic due to macroeconomic sensitivity particularly consumer electronics segment demand variability necessitating disciplined operational agility.
Conclusion
GlobalFoundries demonstrated resilient recovery through the volatile chip cycle by leveraging its core strengths – differentiated proprietary technology enabling high single-sourced product volumes coupled with a strategically dispersed manufacturing footprint reducing geopolitical supply risk exposure. The marked jump back into profitability highlights operational improvements anchored on better shipment utilization rates despite pricing pressures typical within foundry industry structures. The enrichment of its silicon IP portfolio through recent acquisitions provides additional tools for growth beyond commodity wafers supporting expansion into custom silicon-focused market segments increasingly valuable amid AI/automotive megatrends shaping semiconductor content requirements across industries. Capital structure improvements targeting lower debt levels combined with solid cash reserves position GF prudently to fund ongoing R&D investment essential for long-term competitiveness while preserving sufficient liquidity buffers for unforeseen external shocks. Risks persist: notably cyclicality still constrains upside visibility; heavy customer concentration underscores dependency vulnerabilities; rising input costs challenge margin expansion; leadership changes inject some near-term uncertainty though management continuity plans seek mitigation. Overall, GlobalFoundries charts a focused path cultivating unique technological niches amplified by geographic diversification — foundational pillars likely sustaining modest organic growth ahead with key developments around design wins execution/technology roadmaps/capacity utilization critical milestones warranting investor attention.
This report is prepared solely for informational purposes without expressing any investment recommendation or advice.
Disclaimer: This is research-only, informational analysis and not investment advice. It may include AI-generated interpretation and general industry context. Always verify important details using primary sources.
Comments