
KeyCorp’s Commercial Lending Shift: Capital Strength, Deposit Discipline, and the Next Phase for Regional Banks
KeyCorp’s Q3 2026 results highlight a strategic pivot toward commercial lending, disciplined deposit cost management, and robust capital ratios. The bank’s resilience now depends on sustaining loan growth, navigating interest rate volatility, and translating operational strengths into durable profitability in a competitive regional landscape.
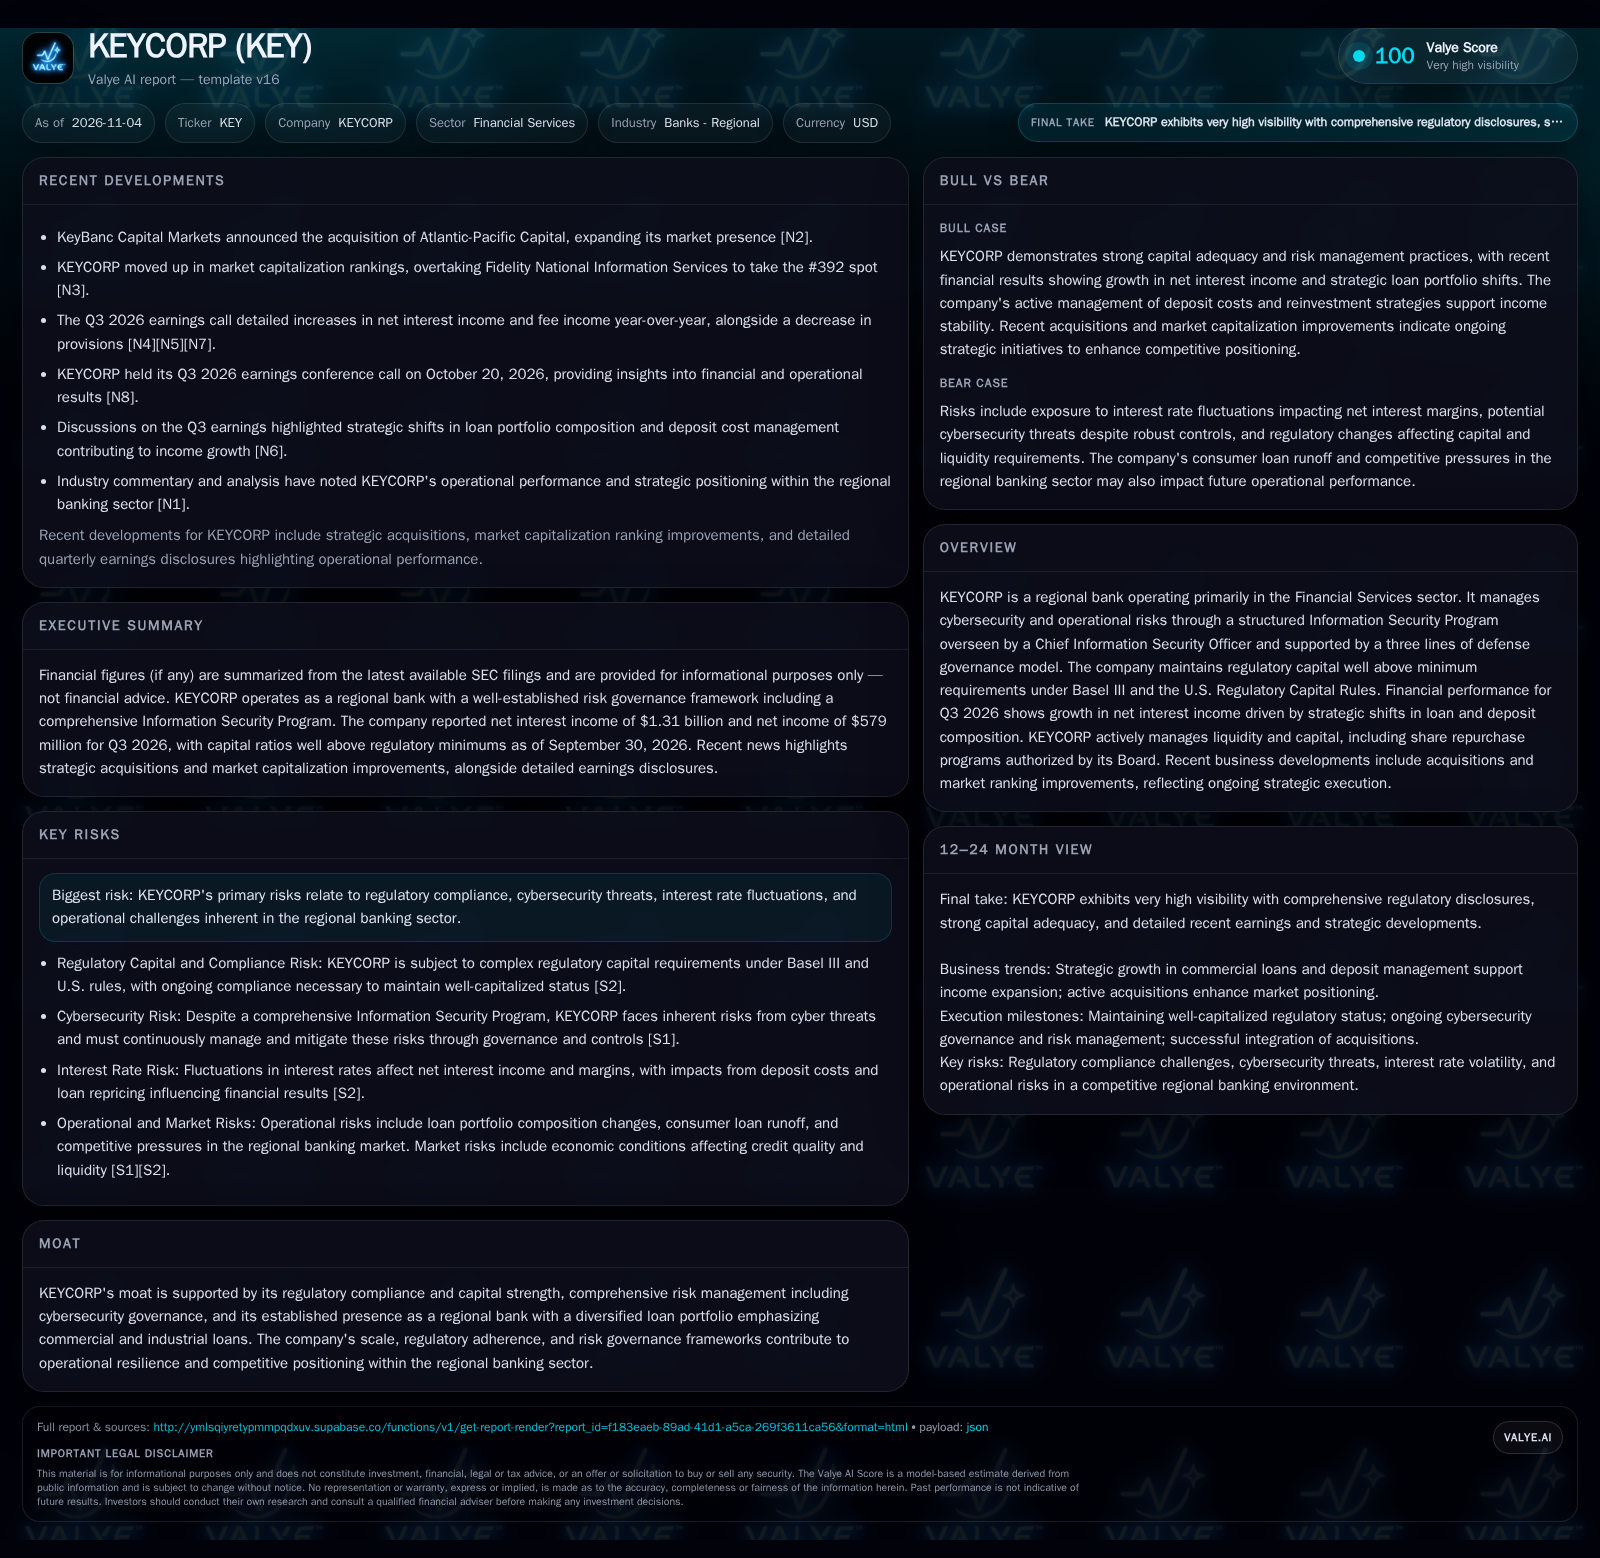
KeyCorp’s latest results show increases in net interest income and fee revenue, with capital ratios well above regulatory minimums. Strategic emphasis on commercial lending and active deposit management have supported margins. The challenge ahead: sustaining growth while mitigating rate, regulatory, and operational risks as the regional banking sector evolves. [S2] [N4] [N5] [N7]
KeyCorp’s Q3 2026 performance underscores a deliberate strategy to amplify commercial and industrial lending while reining in deposit costs—a combination that has lifted net interest income and stabilized margins despite a dynamic rate environment. With capital ratios comfortably above regulatory thresholds and an active risk governance model, KeyCorp enters its next phase with operational strength, but faces persistent challenges: interest rate volatility, ongoing competition from both regional banks and fintechs, and the need to maintain fee and lending momentum as consumer loan balances run off. The next 12-24 months will test whether KeyCorp can turn tactical financial wins into lasting competitive advantage.
Recent Operating Shifts Reinforce Capital and Earnings Profile
As of September 30, 2026, KeyCorp’s regulatory capital ratios were well above minimum requirements, with a Common Equity Tier 1 ratio of 11.08% and a Total Capital ratio of 14.34% [S2]. This capital buffer provides flexibility but also raises expectations for prudent growth and risk management in a sector where regulatory scrutiny remains intense.
Net interest income for Q3 2026 reached $1.31 billion, reflecting an improved net interest margin of 2.95%. This outcome was driven by lower deposit costs, reinvestment in higher-yielding assets, and a pivot toward commercial and industrial loans [S2] [N4] [N5] [N7].
Average loans increased to $111.6 billion, propelled by a $7.7 billion rise in commercial lending, while consumer loan balances declined. Simultaneously, average deposits stood at $151.2 billion, with a favorable shift from time deposits to demand and money market accounts, helping to control funding costs [S2].
The company reported cash and liquidity metrics for the period; these figures do not by themselves establish operating runway, investment capacity, financial flexibility, or financing capacity.
How Commercial Lending and Deposit Mix Impact Core Earnings
KeyCorp’s primary revenue engine is net interest income, which is highly sensitive to loan portfolio composition, deposit mix, and prevailing interest rates. By increasing exposure to commercial and industrial loans—typically higher yielding but riskier than consumer loans—the bank can enhance its interest margin, provided credit quality holds up.
Deposit mix is equally critical. A shift away from higher-cost time deposits to lower-cost demand and money market deposits reduces funding costs, directly supporting margins. The Q3 2026 decrease in deposit costs contributed significantly to net interest income growth [S2].
Fee income, while less significant than interest income for most regional banks, provides diversification, especially as loan growth slows or rate spreads compress. The recent uptick in fee income offers incremental support but is unlikely to change the earnings mix materially unless augmented by new products or services [N4] [N5] [N7].
Operating leverage in banking is nuanced: while higher loan volumes and deposit balances can scale earnings, regulatory compliance, technology investments (notably in cybersecurity), and credit provisioning are substantial fixed or semi-fixed costs. If revenue growth outpaces these costs, margins can expand; if not, efficiency ratios may deteriorate.
Regulatory Capital, Risk Governance, and the Limits of Scale
KeyCorp’s robust capital ratios and comprehensive risk governance—including its three lines of defense model and cybersecurity oversight—constitute its primary competitive defenses [S1] [S2]. These features enable the bank to withstand shocks and meet evolving regulatory standards, which have become more stringent post-2023 for regional banks.
However, competitive pressures from other regional banks, national banks, and increasingly from fintech lenders and digital banks, threaten to erode both loan pricing power and deposit franchise value. While KeyCorp’s scale confers some advantages in technology and compliance, it does not guarantee customer stickiness or superior returns.
Switching frictions in commercial banking are moderate: while long-standing business relationships and bundled services (such as treasury management) can reduce churn, price sensitivity and the lure of digital-first competitors remain real. The question is whether KeyCorp can deepen client relationships and cross-sell effectively enough to offset competitive leakage.
Technology substitution is a growing threat. Digital-native entrants often have lower cost structures and can target profitable segments without legacy branch networks. KeyCorp’s visible investments in cybersecurity and privacy suggest awareness of this risk, but it remains unclear whether these investments will translate into digital customer acquisition or retention advantages.
Margin Expansion and Fee Growth Drive Profitable Share Gains
In a favorable scenario, KeyCorp sustains its commercial loan growth, maintains benign credit quality, and continues to lower deposit costs, resulting in further net interest margin expansion. If fee income accelerates—perhaps through successful cross-selling of treasury, payments, or wealth management services—overall revenue diversification could improve.
Confirmation of this scenario would require: continued quarter-over-quarter growth in commercial lending; a stable or improving net interest margin; further deposit cost reductions; increasing fee income as a share of total revenue; and evidence of stable or improving efficiency ratios. Sustained capital ratios above regulatory minimums would also support growth and potential buybacks.
Falsification would occur if commercial loan growth stalls, credit costs rise sharply, or if competitive pressures force up deposit costs or compress loan yields, eroding margins.
Commercial Loan Growth Offsets Consumer Runoff, but Margin Pressures Persist
The most plausible near-term outcome is that KeyCorp continues to grow its commercial loan book at a moderate pace, while consumer loan balances gradually decline. Deposit mix improvements may have diminishing returns, with deposit costs stabilizing rather than falling further.
Net interest income likely grows modestly, supported by a still-healthy net interest margin, but upside is capped by competitive dynamics and the potential for incremental rate or credit headwinds. Fee income contributes but remains a secondary driver unless new business lines are developed.
Capital ratios remain strong, and the bank maintains disciplined risk management. However, operating leverage gains are incremental, with technology, compliance, and cybersecurity spending offsetting some scale benefits.
Evidence for this scenario includes stable loan growth, flat-to-slightly-rising margins, and continued regulatory compliance. Falsification would require a sharp reversal in loan demand, a spike in credit losses, or regulatory actions that constrain growth or increase capital requirements.
Margin Compression and Credit Deterioration Undermine Resilience
In a negative scenario, rising interest rates or aggressive competition force up deposit costs faster than loan yields can adjust, leading to net interest margin compression. If commercial loan growth slows or reverses and credit quality deteriorates (with rising delinquencies or charge-offs), earnings could contract sharply.
Operational risks, such as a significant cybersecurity incident or regulatory sanction, could also disrupt business continuity or require costly remediation, further straining profitability.
This scenario would be confirmed by: declining net interest margin, rising provisions for credit losses, negative loan growth, and any material increase in non-interest expense related to risk events. A drop in capital ratios toward regulatory minimums would also be a warning sign.
If, instead, margins and credit metrics remain stable and operating expenses are contained, the downside scenario would be less likely.
Testing KeyCorp’s Next Phase: Metrics to Validate Strategic Progress
Quarterly net interest margin trends—sustained expansion or contraction will reveal pricing power and funding discipline.
Sequential commercial and industrial loan growth, both in dollar terms and as a percent of the total portfolio.
Deposit mix evolution—continued shift toward lower-cost deposits, or reversal toward higher-cost funding.
Fee income as a percentage of total revenue and growth in non-interest income lines (if disclosed).
Provisioning trends and credit quality metrics, including non-performing loan ratios and net charge-offs.
Efficiency ratio trajectory—whether KeyCorp can scale revenue faster than operating costs, especially technology and compliance.
Capital ratios (CET1, Total Capital, Leverage) relative to both regulatory minimums and peer benchmarks.
Incidence and impact of any material cybersecurity or operational risk events, and Board/CISO responses (if disclosed).
Disclaimer: This is research-only, informational analysis and not investment advice. It may include AI-generated interpretation and general industry context. Always verify important details using primary sources.

Comments