
Ouster’s Unified Sensing Ambition: Integration, Losses, and the Race for Physical AI Relevance
Despite persistent net losses, Ouster’s high liquidity and full-stack sensing platform position it to compete for share in industrial, robotics, infrastructure, and automotive autonomy. The challenge is to translate technical breadth and recent acquisitions into sustainable economics before rivals or market inertia erode its edge.
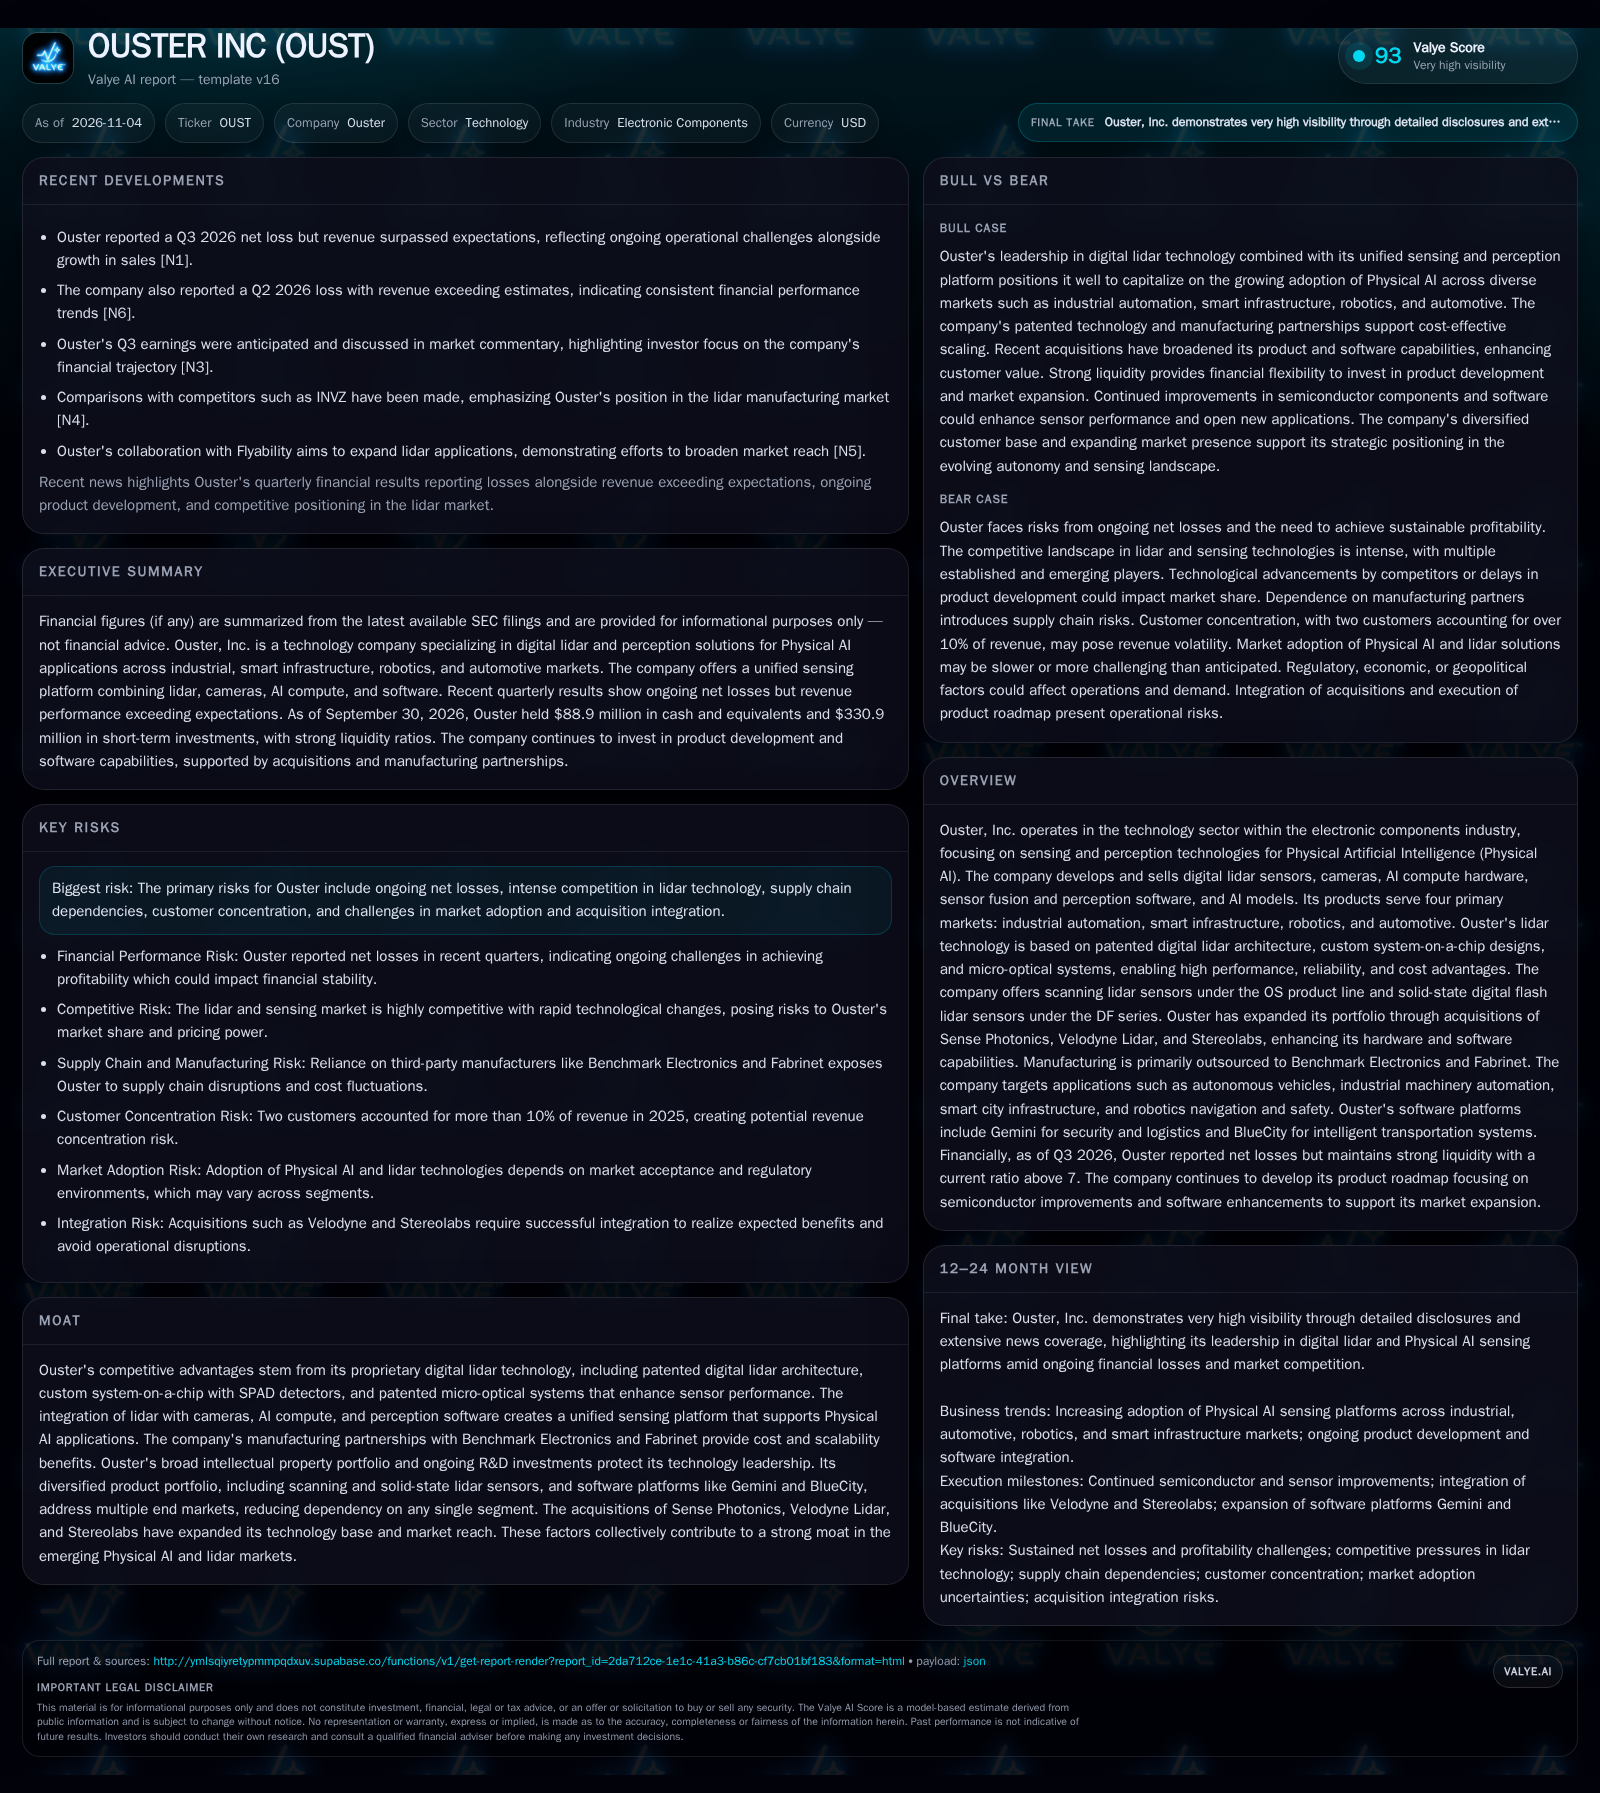
Ouster remains a high-profile contender in digital lidar and unified perception for Physical AI, reporting Q3 2026 losses but revenue above expectations. With over $400M in cash and short-term investments, recent acquisitions (Velodyne, Stereolabs) and continued product development, Ouster targets diversified markets from industrial automation to automotive ADAS. Its moat is rooted in proprietary digital lidar, custom SoCs, and software integration, but profitability, customer concentration, and competitive intensity remain key hurdles. The thesis hinges on whether Ouster can convert its platform breadth and liquidity into scale and margin before market adoption or rivals outpace it. [S1] [S2] [N1] [N6]
Ouster, Inc. stands at a critical juncture in the evolution of machine perception, offering a unified hardware-software platform for Physical AI across industrial, robotics, smart infrastructure, and automotive domains. The company’s challenge now is to translate its technical breadth—spanning digital lidar, custom SoCs, vision, and AI models—into scale, recurring economics, and defensible market share before intensifying competition or slow adoption undercuts its position.
Liquidity, Losses, and Platform Expansion: Ouster’s Current Reality
As of September 30, 2026, Ouster reported a net loss of $14.2 million for the quarter, continuing a trend of negative EPS (-$0.20 basic and diluted) [S2]. Yet, revenue once again surpassed analyst estimates in both Q2 and Q3 2026, suggesting ongoing sales traction despite the lack of profitability [N1] [N6]. This top-line growth is occurring alongside high liquidity: Ouster holds $88.9 million in cash and $330.9 million in short-term investments, with current and cash ratios of 7.13 and 5.71, respectively [S2]. Notably, the company’s acquisition of Stereolabs in 2026 follows its prior integrations of Velodyne (2023) and Sense Photonics, further consolidating its position as a unified sensing platform provider [S1]. The challenge is to leverage these resources and integrations into a path to sustainable profitability and defensible market share.
How Ouster’s Product Mix and Integration Shape Its Economic Model
Ouster’s economics depend on its ability to scale sales of digital lidar and camera-based perception solutions across four core markets: industrial automation, smart infrastructure, robotics, and automotive. The company’s product portfolio spans hardware (scanning and solid-state lidar, AI cameras), custom SoCs, and software (Gemini, BlueCity). In principle, this breadth enables Ouster to address a wide range of price points and use cases—industrial and infrastructure projects may tolerate higher per-unit pricing and integration fees, while automotive and robotics are more price-sensitive and volume-driven.
The integration of cameras and AI perception software (post-Stereolabs) aims to increase average deal size and embed Ouster deeper into customer workflows, which could support higher margins if software and analytics become recurring or subscription-based. However, the company’s reliance on third-party manufacturing (Benchmark Electronics, Fabrinet) limits fixed cost leverage but offers scalability and potential cost advantages at higher volumes [S1]. R&D and integration costs remain substantial, as evidenced by ongoing net losses, and customer concentration (two customers >10% of 2025 revenue) could amplify revenue volatility if any major account is lost or delayed [S1].
The path to attractive unit economics likely hinges on two dynamics: (1) achieving sufficient sales volume to dilute R&D and integration costs, and (2) increasing the software and analytics component of sales to drive recurring revenue and higher gross margins.
Defending Share in a Crowded Lidar and Perception Landscape
Ouster competes in a highly fragmented and rapidly evolving market, facing direct rivals in lidar (e.g., other digital and solid-state lidar manufacturers), as well as broader sensing and perception providers in the Physical AI ecosystem [N4]. Its competitive advantages are rooted in a proprietary digital lidar architecture, custom SoCs, micro-optical systems, and a growing intellectual property portfolio [S1]. The recent integration of perception software and vision hardware (via Stereolabs) aims to offer an end-to-end platform, differentiating Ouster from hardware-only competitors.
However, the sector is characterized by fast-paced innovation, aggressive pricing, and large customers (especially in automotive and industrial) with significant bargaining power. Switching costs may be moderate where Ouster’s perception stack is deeply integrated, but commoditization pressures remain high—particularly as automotive OEMs and robotics integrators seek to standardize on proven, cost-effective suppliers.
Manufacturing partnerships with Benchmark Electronics and Fabrinet provide scalability and cost flexibility, but competitors may pursue similar models or even in-house production to control costs or differentiate on quality. Ultimately, Ouster’s competitive position will depend on its ability to deliver superior performance, reliability, and total cost of ownership, while rapidly evolving its platform to keep pace with customer needs and regulatory requirements.
Platform Leverage: When Integration Delivers Margins and Market Share
In the most favorable scenario, Ouster’s unified platform (lidar, cameras, AI perception software) gains traction across its four target markets, enabling the company to win new high-volume contracts in industrial automation, smart infrastructure, and automotive ADAS. The company leverages its liquidity to accelerate product development, software enhancements, and customer support, outpacing rivals in performance and integration depth.
As adoption of Physical AI accelerates, Ouster’s software component (Gemini, BlueCity) becomes a growing share of revenue, shifting the model toward higher-margin, recurring analytics and platform fees. Manufacturing scale and process improvements (enabled by Benchmark and Fabrinet) further reduce unit costs, while customer diversification lessens revenue volatility. Confirmation of this scenario would come from: (1) a sustained increase in gross margins, (2) a rising portion of revenue from software, analytics, or recurring contracts, (3) evidence of large, multi-year customer wins especially outside the current top two accounts, and (4) narrowing or elimination of net losses as sales scale.
Incremental Adoption, Continued Losses, and Competitive Churn
The most plausible path is that Ouster continues to grow revenue at a healthy pace, aided by ongoing market expansion in industrial, robotics, and infrastructure, but faces persistent margin pressure and lumpy contract timing, especially in automotive. Integration of Stereolabs and Velodyne increases product breadth but also adds complexity and ongoing R&D costs, delaying the company’s move to profitability.
Customer concentration remains a risk, and while Ouster may secure new accounts, the pace of adoption for Physical AI solutions varies by vertical and region. Competitive pricing and the risk of technological leapfrogging by rivals (in both hardware and AI software) keep gross margins below management’s aspirational targets.
Evidence for this scenario would include: ongoing net losses despite revenue growth, gross margin improvement only in small increments, and continued reliance on a few large customers for a significant share of revenue.
When Scale Eludes and Integration Complexity Bites
In the adverse scenario, Ouster’s revenue growth stalls as market adoption of Physical AI and lidar solutions proves slower or more fragmented than anticipated—either due to regulatory delays, economic headwinds, or customer hesitancy to standardize on a unified platform. Intense competition in lidar and perception, including price wars and technological leapfrogging, erodes Ouster’s pricing power and compresses gross margins.
Integration of recent acquisitions fails to yield the expected synergies, resulting in operational inefficiencies, increased R&D and support costs, and possible product delays. Customer concentration risk materializes if one of the top two accounts reduces orders or switches to a competitor, causing revenue volatility and potentially triggering restructuring or cost-cutting. In this scenario, net losses widen, and the liquidity buffer is steadily depleted without a clear path to cash flow breakeven.
Confirmation would come from: (1) declining or flat revenue despite new product launches, (2) deteriorating gross margins, (3) increased operating losses, and (4) signs of customer churn or loss of major contracts.
Milestones That Will Define Ouster’s Physical AI Trajectory
Gross margin trends by segment and over time—especially any sustained improvement that would signal scale benefits or software mix gains.
The proportion of revenue attributable to software, analytics, or recurring contracts (if disclosed), as a test of platform leverage and margin potential.
Customer concentration metrics—specifically whether reliance on the top two accounts diminishes or new large customers are added.
Updates on integration progress and cost synergies from the Stereolabs and Velodyne acquisitions—any evidence of R&D or SG&A leverage.
Volume and value of announced multi-year or high-volume contracts, particularly in automotive and industrial automation.
Evidence of manufacturing cost reductions, improved yields, or supply chain resilience from Benchmark Electronics and Fabrinet partnerships.
Any disclosed customer churn, contract losses, or order delays, which would signal competitive or adoption headwinds.
R&D expenditure trends relative to revenue growth, as an indicator of operating leverage and efficiency improvements.
Disclaimer: This is research-only, informational analysis and not investment advice. It may include AI-generated interpretation and general industry context. Always verify important details using primary sources.

Comments