
Landmark Bancorp: Capital Strength, Interest Rate Risk, and the Realities of Regional Banking Value Creation
The cited source reports dividend-related activity; that disclosure alone does not establish dividend-policy continuity, management confidence, or a material constraint on capital flexibility. The next phase of value creation likely hinges on margin behavior, credit trends, and the company’s ability to navigate the evolving regulatory and economic landscape.
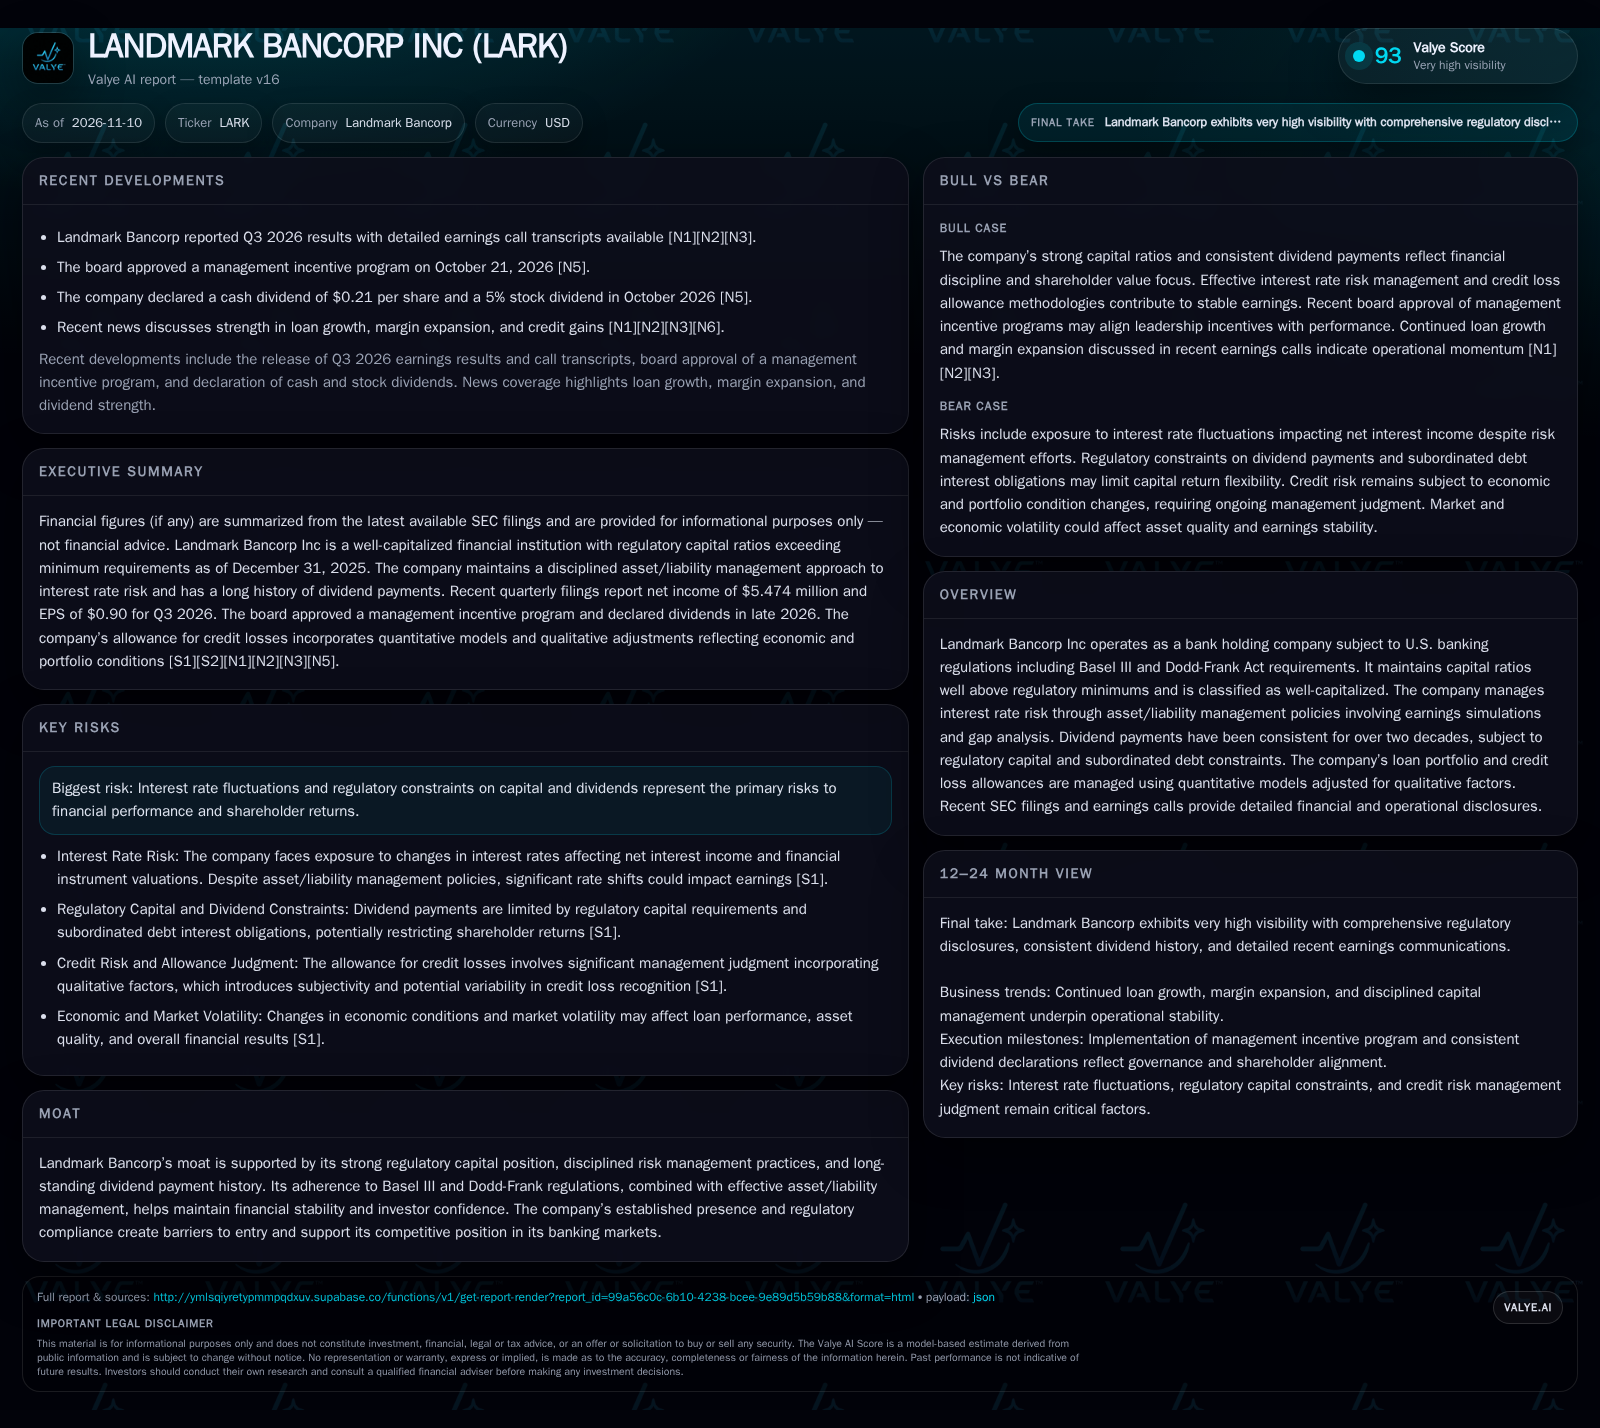
The cited source reports dividend-related activity; that disclosure alone does not establish dividend-policy continuity, management confidence, or a material constraint on capital flexibility. The company’s capital structure, risk management, and loan growth suggest stability, yet external shocks or regulatory shifts could materially affect its performance and flexibility. [S1] [S2] [N1] [N2] [N3]
Landmark Bancorp Inc stands out among regional banks for its resilient capital base, conservative risk management, and remarkable 25-year streak of dividend payments. Its most recent filings show it comfortably exceeds regulatory capital thresholds and continues to generate steady profits, buoyed by prudent asset/liability management and a disciplined approach to credit risk. However, as margin pressures and regulatory requirements persist across the banking sector, Landmark’s ability to sustain earnings growth and capital return flexibility will increasingly depend on its handling of interest rate exposures, loan portfolio quality, and evolving macroeconomic conditions. The strategic question: can Landmark translate its balance-sheet strength into differentiated long-term value for shareholders in a market where external factors often drive the narrative?
Capital Position and Recent Performance Shape Near-Term Flexibility
As of December 31, 2025, Landmark Bancorp maintained a leverage ratio of 9.67% and a total risk-based capital ratio of 13.96%, both well above regulatory minimums and the thresholds for well-capitalized banks. This capital strength provides a buffer against credit and market shocks, as well as regulatory headroom for ongoing operations and measured capital return. The company’s Q3 2026 net income was $5.474 million, with basic EPS of $0.90, and cash and cash equivalents stood at $117.3 million as of September 30, 2026. Landmark has paid quarterly dividends for 25 consecutive years, most recently $0.20 per share in 2025, adjusted for a 5% stock dividend. However, regulatory capital requirements and subordinated debt interest obligations continue to limit dividend flexibility, with $3.0 million available for dividends without prior regulatory approval as of December 31, 2025. [S1] [S2]
How Landmark’s Earnings Engine Works: Spreads, Scale, and Sensitivity
Landmark’s core earnings derive from the spread between interest earned on loans and securities and the interest paid on deposits and borrowings. This net interest margin (NIM) is the primary driver of profitability for most regional banks. The company’s asset/liability management program uses earnings simulations and gap analysis to monitor exposures, seeking to balance rate-sensitive assets and liabilities in order to limit earnings volatility from rate shocks. As of December 31, 2025, the cumulative interest sensitivity gap was $410.9 million, or 27.98% of total interest-earning assets, highlighting a meaningful level of exposure to repricing mismatches. [S1]
Fee income, while present, is generally a smaller contributor for banks of Landmark’s scale. The company must also manage expenses tightly; operating leverage comes from spreading fixed costs over a growing asset base, but rapid changes in deposit costs or credit losses can quickly erode margins. Capital requirements—driven by Basel III and Dodd-Frank—affect both growth and capital return policies, as regulatory minimums must be maintained even in stressed scenarios. Trust preferred securities and subordinated debentures provide some flexibility for capital management, but also introduce fixed servicing obligations that must be covered before dividends are paid. [S1]
Differentiation in a Crowded Regional Banking Field
Landmark operates in a highly competitive regional banking landscape, where peers include community banks, credit unions, and increasingly, fintech-enabled lenders. Its adherence to regulatory discipline and conservative capital management gives it credibility with regulators and risk-averse depositors, creating a moderate barrier to entry for less well-capitalized competitors. The long-standing dividend record and audited financials help build investor trust.
However, the company’s size limits its ability to benefit from economies of scale seen at larger banks, and it faces the same macroeconomic and regulatory headwinds as its peers. Technology-driven entrants may pressure deposit pricing and loan origination, while larger banks can compete more aggressively on product breadth and digital experience. Landmark’s risk management sophistication and local market knowledge may help retain customers, but switching costs remain modest in retail banking, and deposit flows can be fickle in times of market stress.
What Could Unlock Outperformance: Margin Expansion and Credit Stability
Landmark’s best-case scenario involves a stable or rising interest rate environment that expands net interest margins without triggering significant credit deterioration. If the company can continue to grow loans prudently while keeping deposit costs in check, the spread between asset yields and funding costs could widen, driving earnings and dividend capacity higher. Effective asset/liability management—validated through stable or improving NIM and low sensitivity to rate shocks—would reinforce this narrative.
Credit quality is the other critical lever. If the allowance for credit losses remains conservative and actual charge-offs are low, capital can be redeployed to support growth or returned to shareholders. Evidence that would falsify the upside: a sharp rise in credit losses, net interest margin compression, or regulatory action limiting dividend payouts.
Sustained Profitability Amid Macroeconomic Uncertainty
The most plausible scenario is that Landmark maintains its well-capitalized position and continues to deliver steady, if unspectacular, profitability and dividends. Interest rate volatility may compress margins somewhat, but disciplined asset/liability management and a cautious lending posture help preserve earnings. Loan growth is likely moderate, reflecting both competitive conditions and prudent underwriting standards.
Confirmation would come from stable capital ratios, consistent quarterly profitability, and flat-to-modestly growing dividends. Signs of deviation would be a sustained drop in NIM, a notable increase in nonperforming assets, or regulatory tightening that further restricts capital return.
How Negative Rate Shocks or Credit Stress Could Derail the Story
A meaningful downside scenario involves either a sharp inversion of the yield curve or a rapid rise in deposit costs not matched by asset yield increases, compressing net interest margins and squeezing profitability. If macroeconomic deterioration or sector-specific stress (such as commercial real estate weakness) leads to rising credit losses, the company may be forced to increase its allowance for credit losses, directly impacting earnings and potentially eroding capital ratios.
If capital ratios approach regulatory minimums, dividend payments could be suspended or reduced, especially if subordinated debt interest payments take priority. Confirmation would come from a declining NIM trend, rising charge-offs and nonperforming assets, or a regulatory intervention restricting capital returns. Falsifying evidence would be stable or improving margins and credit metrics, even amid broader sector volatility.
Signals That Will Define Landmark’s Value Creation Trajectory
Quarterly net interest margin (NIM) trends, especially sensitivity to changes in the yield curve and deposit costs.
Allowance for credit losses as a percentage of total loans, and any changes in the qualitative adjustments disclosed.
Growth or contraction in nonperforming assets and charge-off rates; a useful metric would be net charge-offs as a percent of average loans if disclosed.
Quarterly and annual changes in capital ratios relative to regulatory minimums and well-capitalized thresholds.
Dividend payout ratio and any changes in quarterly dividend declarations, especially if tied to earnings or capital movements.
Earnings simulation model disclosures in asset/liability management—particularly projected impacts of parallel and non-parallel interest rate shocks, if disclosed.
Management commentary on loan growth, deposit flows, and competitive pressures in earnings calls or filings.
Regulatory or macroeconomic developments affecting regional banks, such as changes to Basel III requirements or deposit insurance rules.
Disclaimer: This is research-only, informational analysis and not investment advice. It may include AI-generated interpretation and general industry context. Always verify important details using primary sources.

Comments