
Alliant Energy's Growth Fueled by Regulated Utility Expansion Despite Regulatory and Infrastructure Risks
Alliant Energy leverages regulated electric and gas operations in the Midwest to sustain growth, while balancing capital-intensive infrastructure investments and evolving regulation.
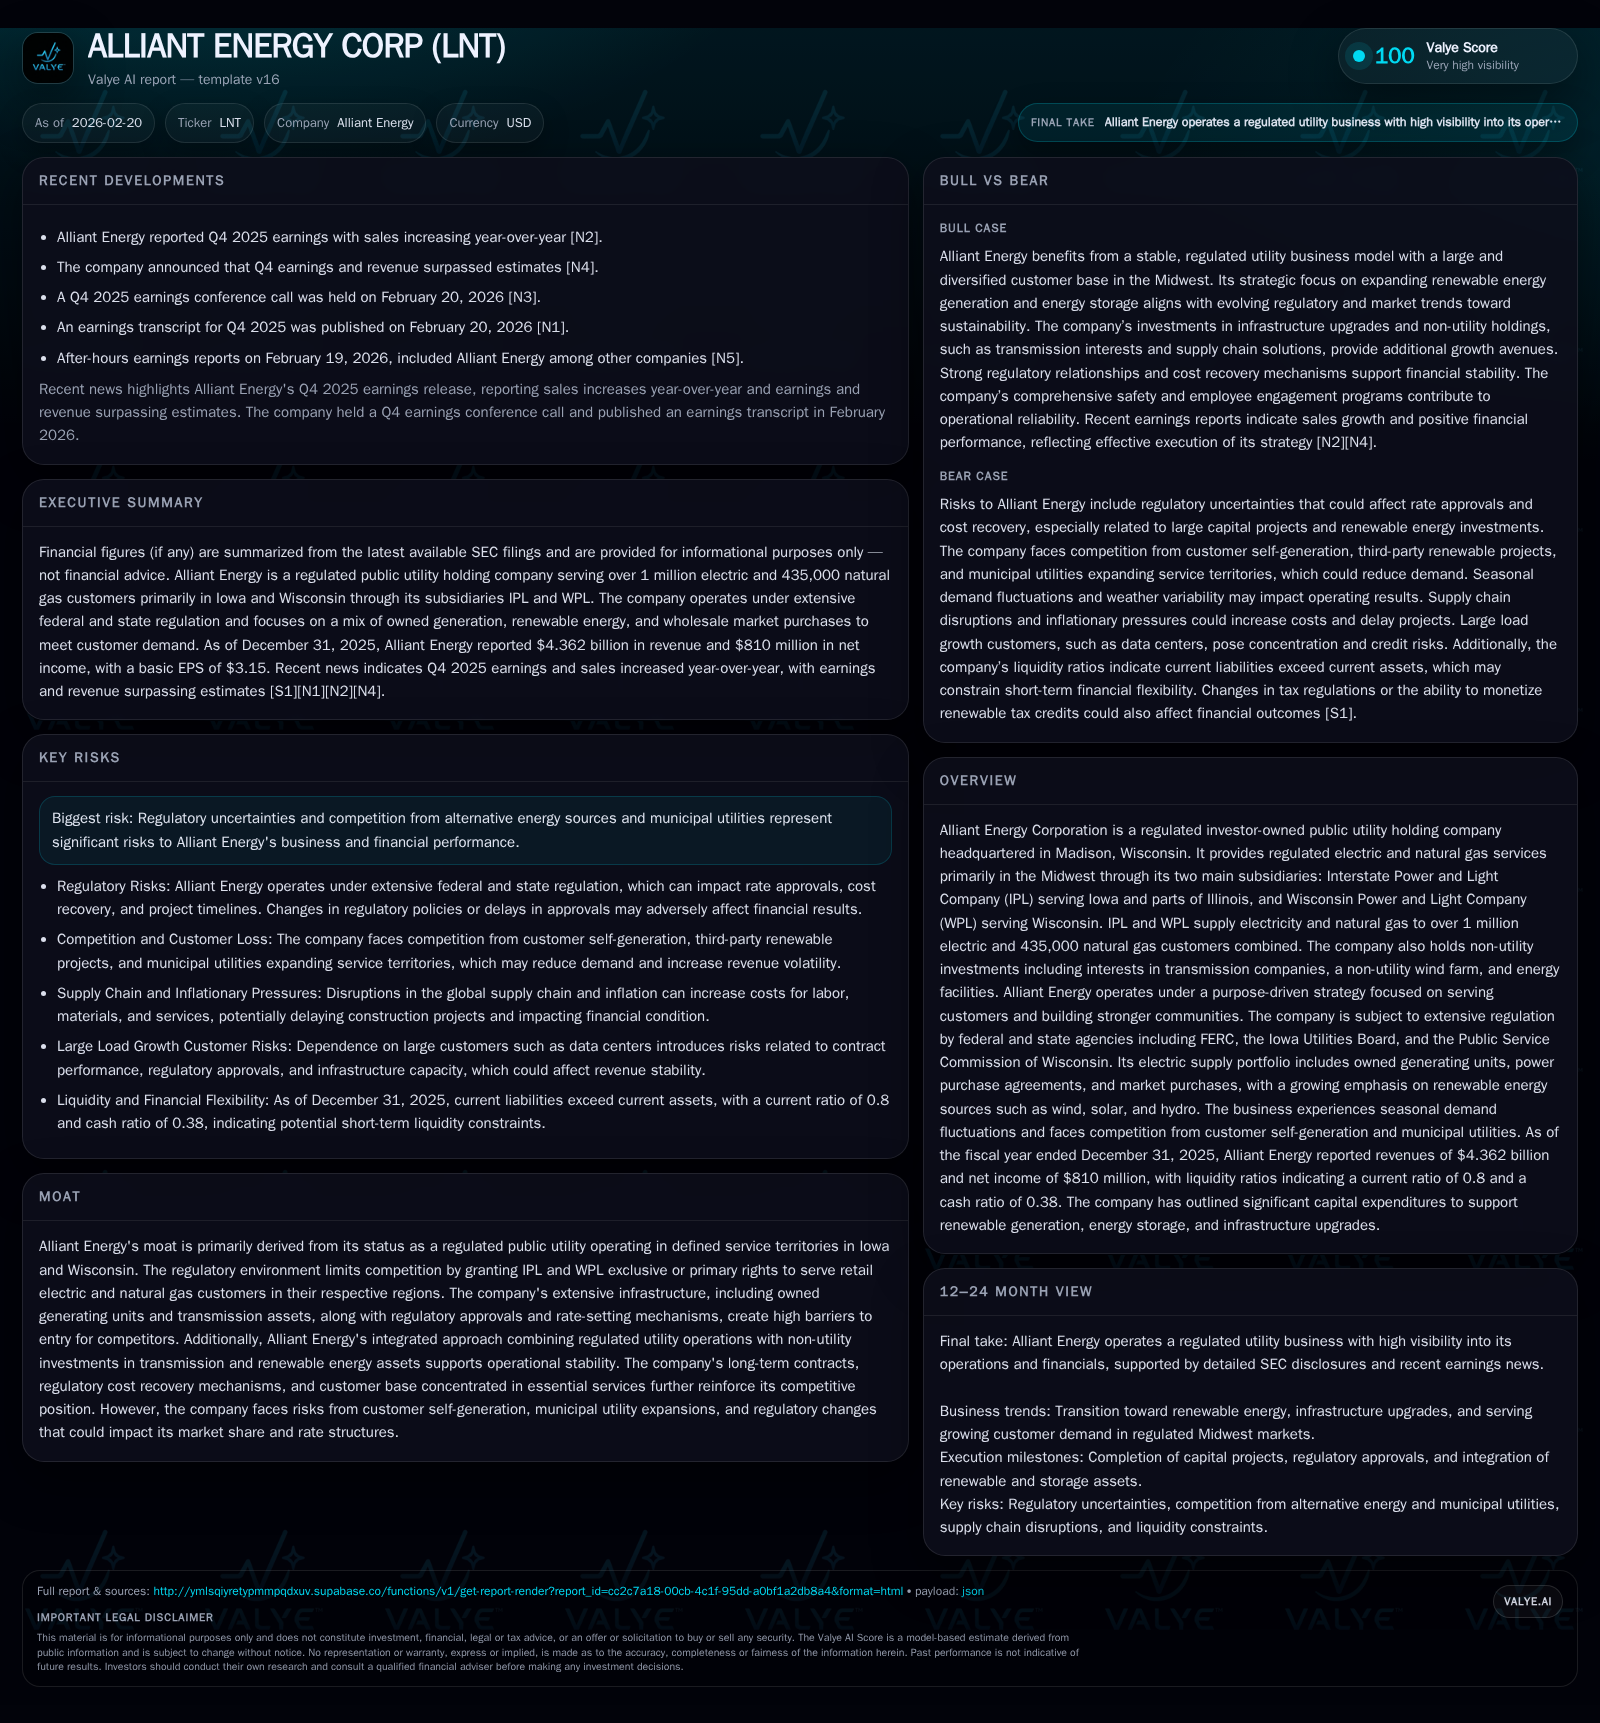
Alliant Energy Corporation, through its subsidiaries IPL and WPL, serves over 1.4 million electric and natural gas customers across Iowa and Wisconsin. The company’s historically steady revenue and earnings growth has been supported by regulated rate recoveries and expansion into renewable energy. However, Alliant faces regulatory uncertainties, infrastructure delivery risks, and customer concentration from large load growth customers like data centers. Capital expenditures remain elevated as it progresses on renewables, grid upgrades, and natural gas facilities. Returns are supported by steady net income growth and strong operating cash flow, though free cash flow is negative due to investment outlays. Regulatory approvals and cost recovery will be pivotal milestones to watch going forward.
Company Overview
Alliant Energy Corporation operates as a regulated investor-owned utility headquartered in Madison, Wisconsin, serving roughly 1 million electric customers and over 435,000 natural gas customers primarily across the Midwest states of Iowa (via Interstate Power and Light Company - IPL) and Wisconsin (via Wisconsin Power and Light Company - WPL) [S1][S15]. The company’s service territories provide essential electricity and gas services to residential, commercial, industrial sectors including significant presence in farming, manufacturing, chemical processing—including ethanol—and data center loads [S23].
The company also holds non-utility investments through its Alliant Energy Finance (AEF) segment including equity stakes in transmission entities such as ATC Holdings (~16%), a non-utility wind farm (225 MW partial ownership), and other ventures focused on emerging energy technologies [S11]. This diversified asset base helps stabilize operational cash flows alongside regulated revenue.
The business model is underpinned by regulatory exclusivity within defined service territories that limits competition from alternative suppliers or municipalization efforts but subjects the utility subsidiaries to intensive oversight by state commissions (Iowa Utilities Board for IPL; Public Service Commission of Wisconsin for WPL) and federal regulator FERC [S5][S16].
Historical Financial Performance
The past four years show solid growth trends with revenues expanding reflects increased customer demand, incremental rate increases approved by regulators to recover capital investments, and additions to renewable generation capacity:
Historical performance (annual)
| FY | Rev ($bn) | Net ($mm) | CFO ($mm) | OpInc ($mm) | Rev YoY | Net YoY |
|---|---|---|---|---|---|---|
| 2025 | 4.4 | 810 | 1169 | 1025 | +9.6% | +17.4% |
| 2024 | 4.0 | 690 | 1167 | 886 | -1.1% | -1.8% |
| 2023 | 4.0 | 703 | 867 | 943 | -4.2% | +2.5% |
| 2022 | 4.2 | 686 | 486 | 928 |
Note: Omitted columns lack sufficient annual XBRL coverage in the provided tags (need ≥2 annual points): Capex, Buybacks, FCF. Source: SEC companyfacts cache [F1].
Capital returns and efficiency (annual)
| FY | Div ($mm) | ROE% |
|---|---|---|
| 2025 | 521 | 11.0 |
| 2024 | 492 | 9.9 |
| 2023 | 456 | 10.4 |
| 2022 | 428 | 10.9 |
Source: SEC companyfacts cache [F1].
Note: Operating cash flow improved markedly from FY22 through FY24 before flattening; capex jumped significantly in recent years though exact annual capex for FY23–25 is not disclosed here [F1].
Operating income jumped strongly (+15.7% YoY in FY25), outpacing revenue growth mainly due to scaling benefits from increasing rate base along with operational efficiencies [F1]. Net income rose sharply by over 17%, supporting an approximate return on equity near 11%, given equity reached $7.33 billion end of fiscal year [F1].
Dividend payout has exhibited consistent growth reflecting stable cash flows with payouts increasing from $428 million in FY22 to $521 million in FY25 [F1]. Buybacks data are not available but the company underscores disciplined capital allocation balancing growth investments with shareholder returns [S10].
Growth Drivers & Prospects
Growth for Alliant Energy is concentrated around several key areas:
- Customer Base Expansion & Load Growth: steady increases in retail electric/gas customers driven by regional economic activity including agriculture and manufacturing; however large load customers—such as data centers—introduce both opportunity for significant volume growth but also contract risk if projects delay or cancel [S6][S7].
- Regulatory Rate Base Growth: Alliant benefits from cost-of-service regulation allowing recovery of prudently incurred capital investments including infrastructure upgrades that increase rate base contributing incremental earnings [S16][N1].
- Renewable Energy Buildout: company actively retires coal assets while deploying solar/wind capacity plus energy storage facilities consistent with its voluntary greenhouse gas reduction goals responding to environmental regulation and market expectations [S24][N1].
- Grid Modernization & Reliability Investments: upgrades to transmission and distribution networks to accommodate new clean generation resources as well as improve resilience against weather disruptions align with regulatory mandates offering cost recovery opportunities [S14][S18].
- Non-Utility Growth Assets: selective deployment of capital in transmission affiliates or clean energy ventures supplements regulated earnings [S11].
Challenges that could cap growth include prolonged regulatory delays or disallowances impairing recovery of investment costs; rising inflation impacting materials/labor costs that may not be fully passed through rates; competition from self-generation or municipal utilities eroding customer base; supply chain constraints delaying project execution; weather-driven demand variability; and technological shifts reducing energy consumption per unit output [S4][S12][S19].
Forecasts & Key Milestones to Watch
While no explicit guidance for future revenue or earnings has been provided beyond recent filings [N1], industry dynamics suggest several milestones:
- Timely completion and regulatory approval of new renewable energy projects will be closely monitored.
- Outcomes of rate cases before Iowa Utilities Board (IPL) and PSC Wisconsin (WPL), especially regarding rate base moratorium extensions or adjustments.
- Integration progress of new large load contracts such as data centers including transmission infrastructure readiness.
- Ability to control inflation-related cost escalations while securing timely tariff adjustments.
- Recovery performance aligned with announced greenhouse gas emission targets amid evolving EPA regulations.
Market participants should also track Midwest Independent System Operator (MISO)'s capacity accreditation updates influencing resource adequacy requirements faced by Alliant's generating assets [S18]. The company's ability to access capital markets affordably amidst ongoing ~$13 billion planned capital expenditure program will be critical for sustaining long-term growth plans [S10][N1].
Returns & Capital Allocation
Return on equity is estimated at approximately 11% based on reported net incomes relative to shareholders’ equity totaling $7.33 billion at fiscal year end [F1]. Operating cash flows are strong at about $1.17 billion annually but free cash flow turns negative when subtracting sizeable capital spending reflecting heavy ongoing investment commitments approximated at $13 billion over four years starting around FY22 levels which were ~$1.5 billion annually according to older disclosed amounts [F1][S10].
Dividend payments have increased steadily each year reaching $521 million in FY25 demonstrating management’s commitment to sharing cash flows with shareholders while maintaining investment capacity [F1]. No information about share repurchases was disclosed during this period.
The balance sheet remains leveraged consistent with utility industry norms but liquidity positions appear sufficient with cash balances around $556 million at FY25 end providing short-term flexibility amid volatile economic conditions [F1][S23].
Industry Context & Operational Nuances
The utility sector faces heightened scrutiny on decarbonization mandates requiring mixes that increasingly favor renewables versus coal/fossil fuel generation while maintaining reliability margin constraints imposed by groups like MISO whose seasonal reserve margins recently ranged widely between ~15% summer up to over ~40% winter periods demanding flexible capacity planning [S23]. Alliant's fleet includes natural gas-fired plants that act as flexible peakers supporting integration of intermittent wind/solar resources deployed aggressively in Iowa/Wisconsin.
Supply chain challenges remain material as construction delays or inflationary pressures can affect capital costs potentially impacting overall project economics given utility projects often span multiple years requiring extensive permitting including community acceptance especially for large customer load expansions such as data centers that tend toward high power density demands prompting new transmission buildouts (e.g., substation transformers rated at increasing MVA levels) which can face local opposition [S6][S7][S16].
Risks Summary
Alliant faces multi-dimensional risks primarily stemming from:
- Regulatory uncertainty over rate approvals or emission compliance costs potentially impairing set returns.
- Large load customer concentration leading to volatility if demand falls short or terminals early.
- Physical risks from extreme weather events causing outages or damage recovery costs beyond insurance coverage.
- Cybersafety threats targeting operational technology systems critical for grid reliability.
- Commodity price fluctuations particularly natural gas which impact generation costs where fuel cost recovery mechanisms are imperfect.
- Inflation-induced cost escalation that may not be fully recoverable within timely regulatory frameworks.
- Competition from behind-the-meter solar plus third-party owned distributed generation reducing retail volumes.
Conclusion
Alliant Energy stands as a Midwestern utility anchored by stable regulated income streams complemented by strategic positioning into renewable energy assets meeting rising environmental expectations. Its recent financial results highlight reliable revenue gains and solid profit expansion alongside heavy reinvestment aimed at modernization and cleaner generation mix shifts.
Nevertheless, the balancing act between maintaining authorized returns amid a dynamic regulatory landscape, managing complex infrastructure construction amid supply chain volatility, accommodating large power load customers requiring customized solutions, all compound the execution risk profile going forward.
Investors should monitor regulatory filings for rate case outcomes, construction progress on renewable and transmission investments vital for long-term earnings trajectory sustainability along with evolving environmental policy metrics influencing asset retirement schedules or required compliance expenditures.
This analysis is intended solely for informational purposes based on publicly available filings without constituting investment advice or recommendations related to Alliant Energy Corporation securities.
Disclaimer: This is research-only, informational analysis and not investment advice. It may include AI-generated interpretation and general industry context. Always verify important details using primary sources.
Comments