
PPL Corp's Revenue Growth and Regulatory Dynamics Shape 2025 Financial Outcomes
The interplay of regulatory rate adjustments, capital restructuring, and sustainability governance defined PPL Corp’s mixed financial results in 2025.
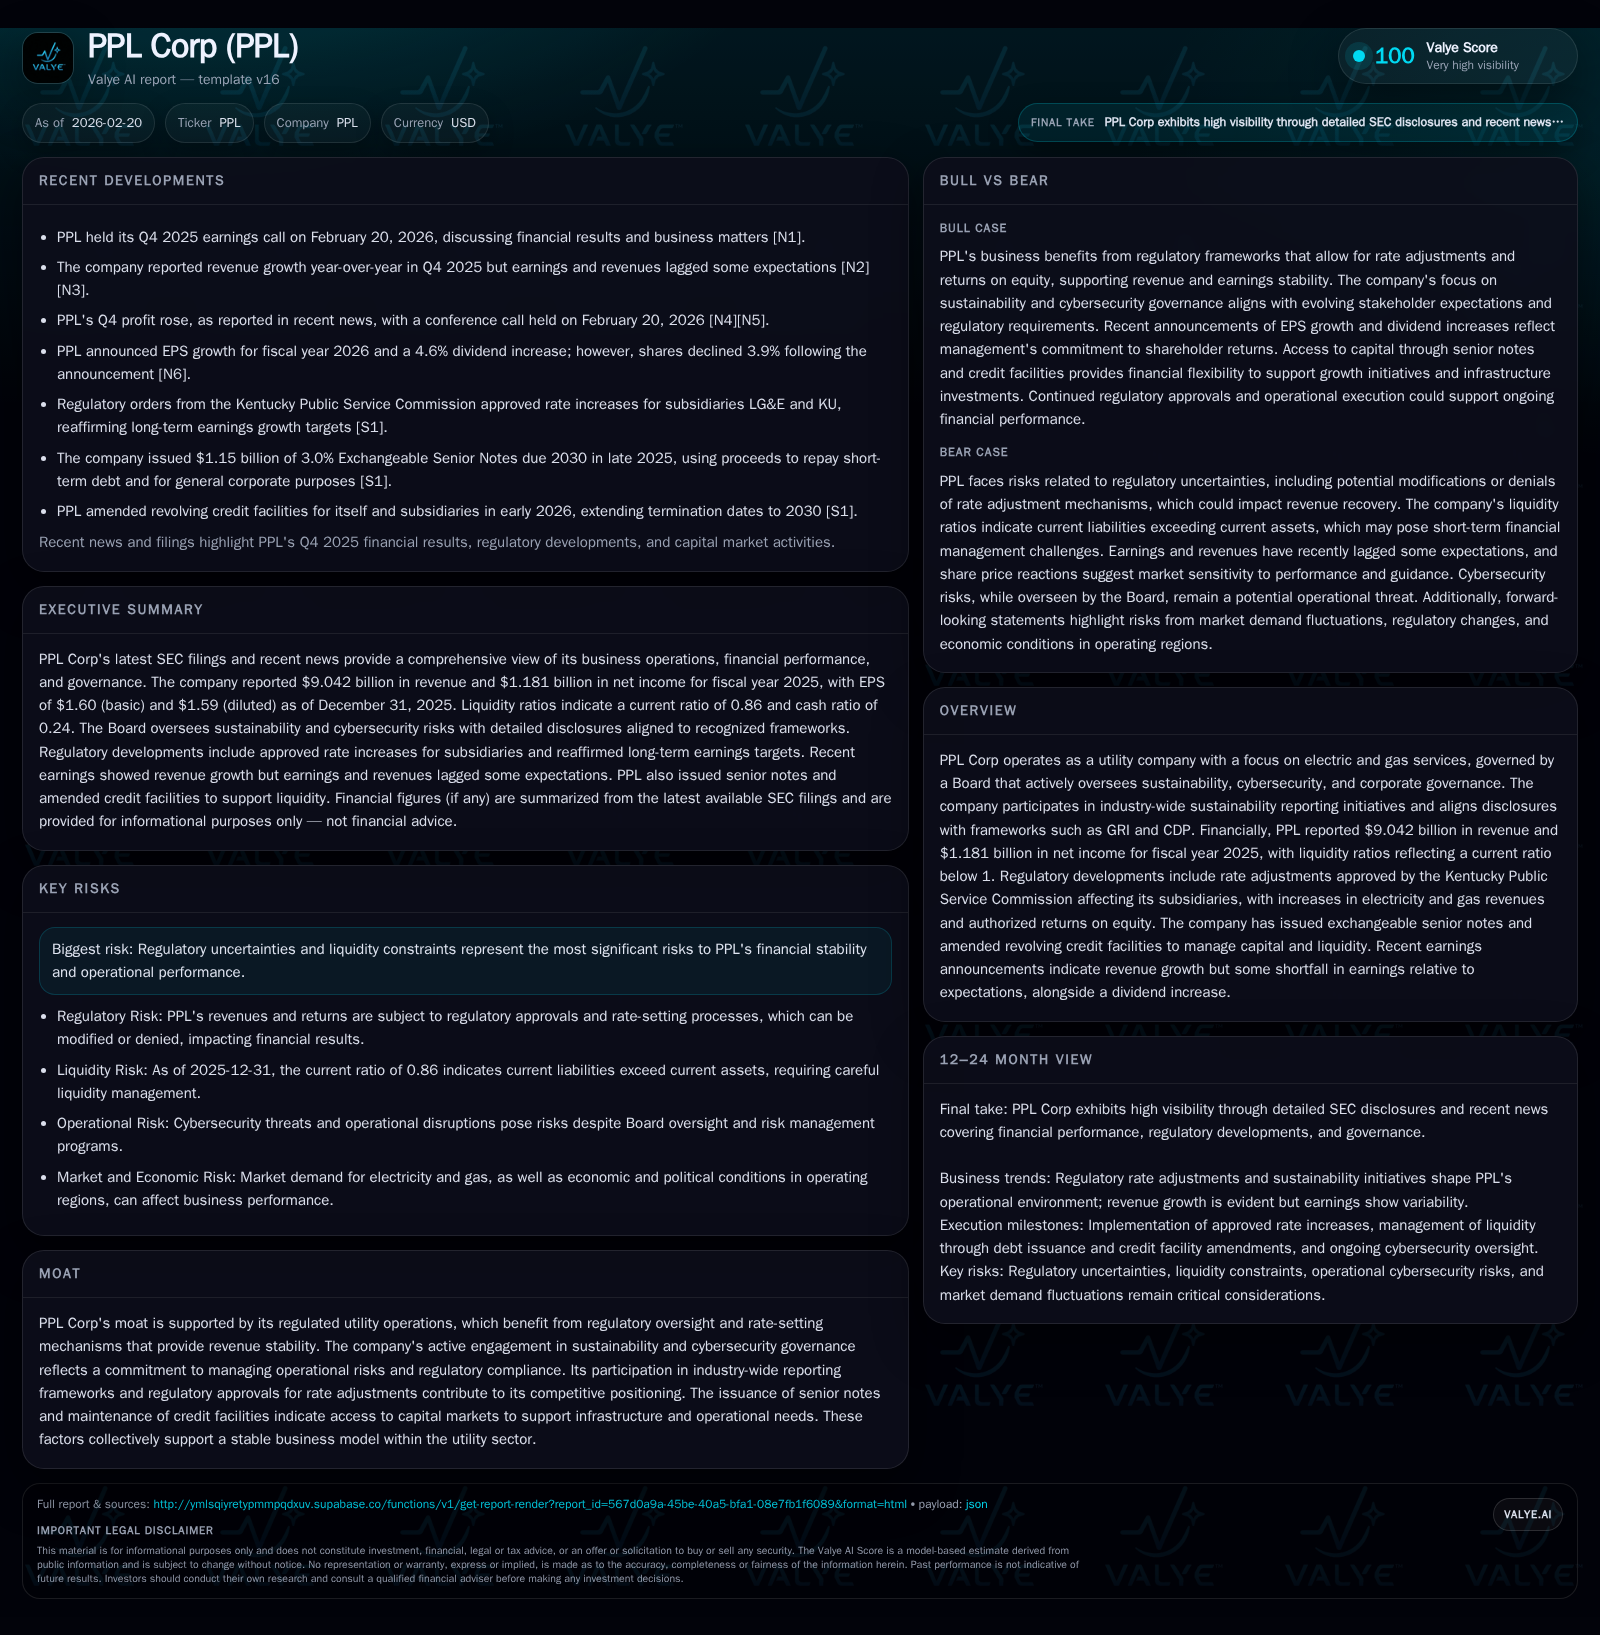
In fiscal year 2025, PPL Corp delivered top-line growth driven by regulatory rate approvals but encountered earnings pressures associated with rising capital expenditures and regulatory uncertainties. The company fortified its liquidity by extending credit facilities and issuing exchangeable senior notes, while the Board heightened oversight on sustainability and cybersecurity matters. Dividend increases proceeded despite constrained free cash flow, reflecting a balancing act between shareholder returns and investment needs. Looking ahead, ongoing regulatory proceedings and operational execution remain pivotal to PPL’s performance trajectory.
PPL Corp’s Financial Performance Trends: Growth Patterns Through 2025
PPL Corp reported revenues of $9.042 billion for fiscal year (FY) 2025, marking a healthy 6.9% increase over FY2024 levels ($8.462 billion)[F1]. This top-line expansion was broadly underpinned by regulatory-sanctioned rate adjustments in its Kentucky subsidiaries that raised both electricity and gas revenues[N1][S13]. Operating income advanced even more robustly at +22.4%, reaching nearly $2.129 billion[F1], signaling some operational leverage despite rising costs.
Net income exhibited a more mixed picture — while climbing by roughly a third (33%) to $1.181 billion[F1], it reflected ongoing margin pressure attributable partly to the sharp escalation in capital investments which soared 43.7% year-over-year to $4.03 billion[F1]. The surge in capex outstripped operating cash flows of $2.629 billion[F1], inducing a negative free cash flow position of approximately -$1.4 billion when subtracting capex from cash flow from operations.
The financial trajectory epitomizes the tradeoff between growth-oriented capital deployment—especially network modernization and generation assets—and short-term profitability constraints.
Historical performance (annual)
| FY | Rev ($bn) | Net ($mm) | CFO ($bn) | OpInc ($bn) |
|---|---|---|---|---|
| 2025 | 9.0 | 1181 | 2.6 | 2.1 |
| 2021 | 8.5 | 888 | 2.3 | 1.7 |
| 2019 | 7.6 | 1469 | 2.7 | 2.8 |
| 2018 | 2.8 |
Note: Omitted columns lack sufficient annual XBRL coverage in the provided tags (need ≥2 annual points): Capex, Buybacks. Source: SEC companyfacts cache [F1].
Capital returns and efficiency (annual)
| FY | Div ($mm) | FCF ($mm) | ROE% |
|---|---|---|---|
| 2025 | 794 | -1401 | |
| 2021 | 747 | -465 | 6.4 |
| 2019 | 1275 | -503 | 11.0 |
| 2018 | 1133 | -417 |
Source: SEC companyfacts cache [F1].
FCF approximated as CFO minus Capex; missing data for years before FY2024 omitted.
Understanding Regulatory Impacts on Revenue and Operating Margins
The reinforcing factor on revenue growth has been multiple rate case approvals by the Kentucky Public Service Commission (KPSC), which authorized increases in base rates for both electric and natural gas utilities operated through PPL’s Kentucky subsidiaries[N1][S13][S20]. These outcomes included authorized returns on equity (ROE) aligned with regulated utility standards, providing a margin floor amid cost inflation.
However, the KPSC modified or denied certain stipulations previously proposed by PPL, such as an earnings-sharing mechanism adjustment clause, introducing some uncertainty into future earnings stability[S13]. Regulatory lag—the inevitable delay between incurring costs and recovering them through tariffs—continues to exert transitional pressure on operating margins.
Within the broader utility sector context, authorized ROEs typically range between mid-8% to low-double digits depending on jurisdiction; PPL's approximate ROE based on net income over equity stands at about 8.5% for FY2025[F1], indicating typical regulated utility returns that necessitate efficient capital deployment.
Rate design complexities such as tariff structures for industrial customers, including data centers (subject to new high load factor tariffs), further complicate revenue forecasts[S20]. Generally, these regulatory dynamics underscore the delicate balance of maintaining revenue certainty while meeting regulator expectations for prudent cost control.
Capital Structure Evolution: Debt Management and Credit Facility Amendments
To support substantial infrastructure investments amidst constrained internal cash generation, PPL strategically augmented its capital structure during late 2025 and early 2026 via several measures:
- Issuance of $1.15 billion aggregate principal amount of 3% exchangeable senior notes due December 2030[S11][S16], offering fixed interest payments while providing potential equity conversion options that can reduce leverage upon exercise.
- Extension of revolving credit facility maturities from December 2029 to December 2030 across several subsidiaries totaling several billion dollars[S5][S7][S10][S21], thereby enhancing short-term liquidity flexibility.
- Retention of access to institutional credit markets under favorable terms supports ongoing network capex plans without immediate dilution or restrictive covenants beyond routine merger limitations[S19][S25].
Despite these moves, current liquidity ratios remain below unity (0.86)[F1], reflecting temporary working capital tensions likely driven by timing mismatches in receivables versus liabilities alongside elevated capex commitments.
Notably absent are any share repurchase programs over recent years[F1]. This aligns with a strategic posture prioritizing debt management and investment funding before engaging in return-of-capital activities via buybacks.
Sustainability Oversight and Cybersecurity Governance as Strategic Pillars
Distinctive among utilities balancing modernization challenges, PPL’s Board demonstrates proactive stewardship over sustainability and cybersecurity risks, critical dimensions for regulated infrastructure companies[S1][S8][S15].
The Governance, Nominating and Sustainability Committee oversees corporate sustainability strategy including environmental impact disclosures aligned with frameworks such as the Global Reporting Initiative (GRI) Standards and CDP Climate questionnaires[S8]. This includes commitments to mitigate carbon emissions consistent with industry best practices promoted by organization alliances like the Edison Electric Institute.
Cybersecurity governance features direct Board involvement complemented by periodic updates from the Chief Security Officer at least biannually[S15]. Notably, Board members hold credentials pertinent to cyber-risk oversight—a sector-best practice ensuring enterprise risk management frameworks robustly address evolving digital threats impacting grid resilience.
In this setting, cybersecurity risk reporting is integrated within quarterly Audit Committee reviews to maintain vigilant operational risk controls per estabished norms across utility enterprises[S15]. This layered governance approach enhances PPL’s moat by protecting asset reliability against externally induced disruptions.
Dividend Increases Amid Liquidity Constraints: Assessing Shareholder Returns
Despite stretched liquidity conditions induced by capex outflows surpassing operational cash generation[F1], PPL elected to raise its dividend payout by approximately 4.6% effective FY2026[N8]. Dividend payments totaled $794 million in FY2025, modestly above prior years (e.g., $747 million in FY2024)[F1].
This reflects a conscious 'liquidity-driven distribution' policy wherein dividends remain important signals of corporate stability but are carefully balanced against funding requirements for utility investment priorities[N8][F1]. The absence of buybacks bolsters this view that capital retention is favored over share repurchasing amid elevated spending demands.[F1]
Dividend yield considerations for investors typically respond sensitively in utilities given their bond-like characteristics; thus consistent dividends support valuation even when earnings or free cash flow metrics experience transient headwinds.
Forward-Looking Considerations: Rate Cases, Operational Challenges, and Market Sentiment
Management commentary during Q4 FY2025 earnings calls anticipates EPS growth for FY26 accompanied by steady revenue momentum but tempered by acknowledged risks from regulatory developments[N1][N8]. Market reaction—shares fell around 3.9% post-announcement—signals investor caution due primarily to uncertainties tied to rate case outcomes yet pending[S13][N2].
Key catalysts on watch include:
- Finalization of Rhode Island Energy’s pending two-year rate plan seeking nearly $230 million cumulative incremental revenue effective late-2026[S28];
- Outcomes from any rehearings/appeals following Kentucky PSC decisions affecting allowed returns or adjustment mechanisms[S13];
- Timing risk around capital projects entering service affecting recovery clauses linked with pilot adjustment clauses customized for new generation assets[S20].
Operational execution risk also factors moderately given scale-up challenges inherent in large network upgrade programs characteristic of regulated utilities aiming for grid resiliency enhancements.
What to Watch: Catalysts and Risks in PPL’s Execution Blueprint
Investors should closely monitor:
- Regulatory lag dynamics that delay full cost recovery pressuring near-term earnings despite longer-term structural benefits[S4];
- Any modifications in ratemaking constructs such as rider mechanisms impacting revenue visibility;
- Capital allocation discipline especially regarding prioritization between debt repayment vs reinvestment vs shareholder returns;
- Cybersecurity incident developments or material sustainability compliance shifts that could impose reputational or financial costs[S15];
- Liquidity coverage evolution as reflected in credit facility utilization rates vis-à-vis project funding needs[S10].
These factors collectively form key determinants for PPL's ability to sustain its regulated utility moat amid evolving industry demands.
Disclaimer: This report is for informational purposes only and does not constitute investment advice or recommendations regarding securities transactions.
Disclaimer: This is research-only, informational analysis and not investment advice. It may include AI-generated interpretation and general industry context. Always verify important details using primary sources.
Comments