
LATAM Airlines Group: Revitalizing Passenger Growth and Strategic Capital Management
LATAM Airlines Group has successfully transitioned from bankruptcy restructuring to renewed growth in passenger volumes while deploying strategic capital management to stabilize finances.
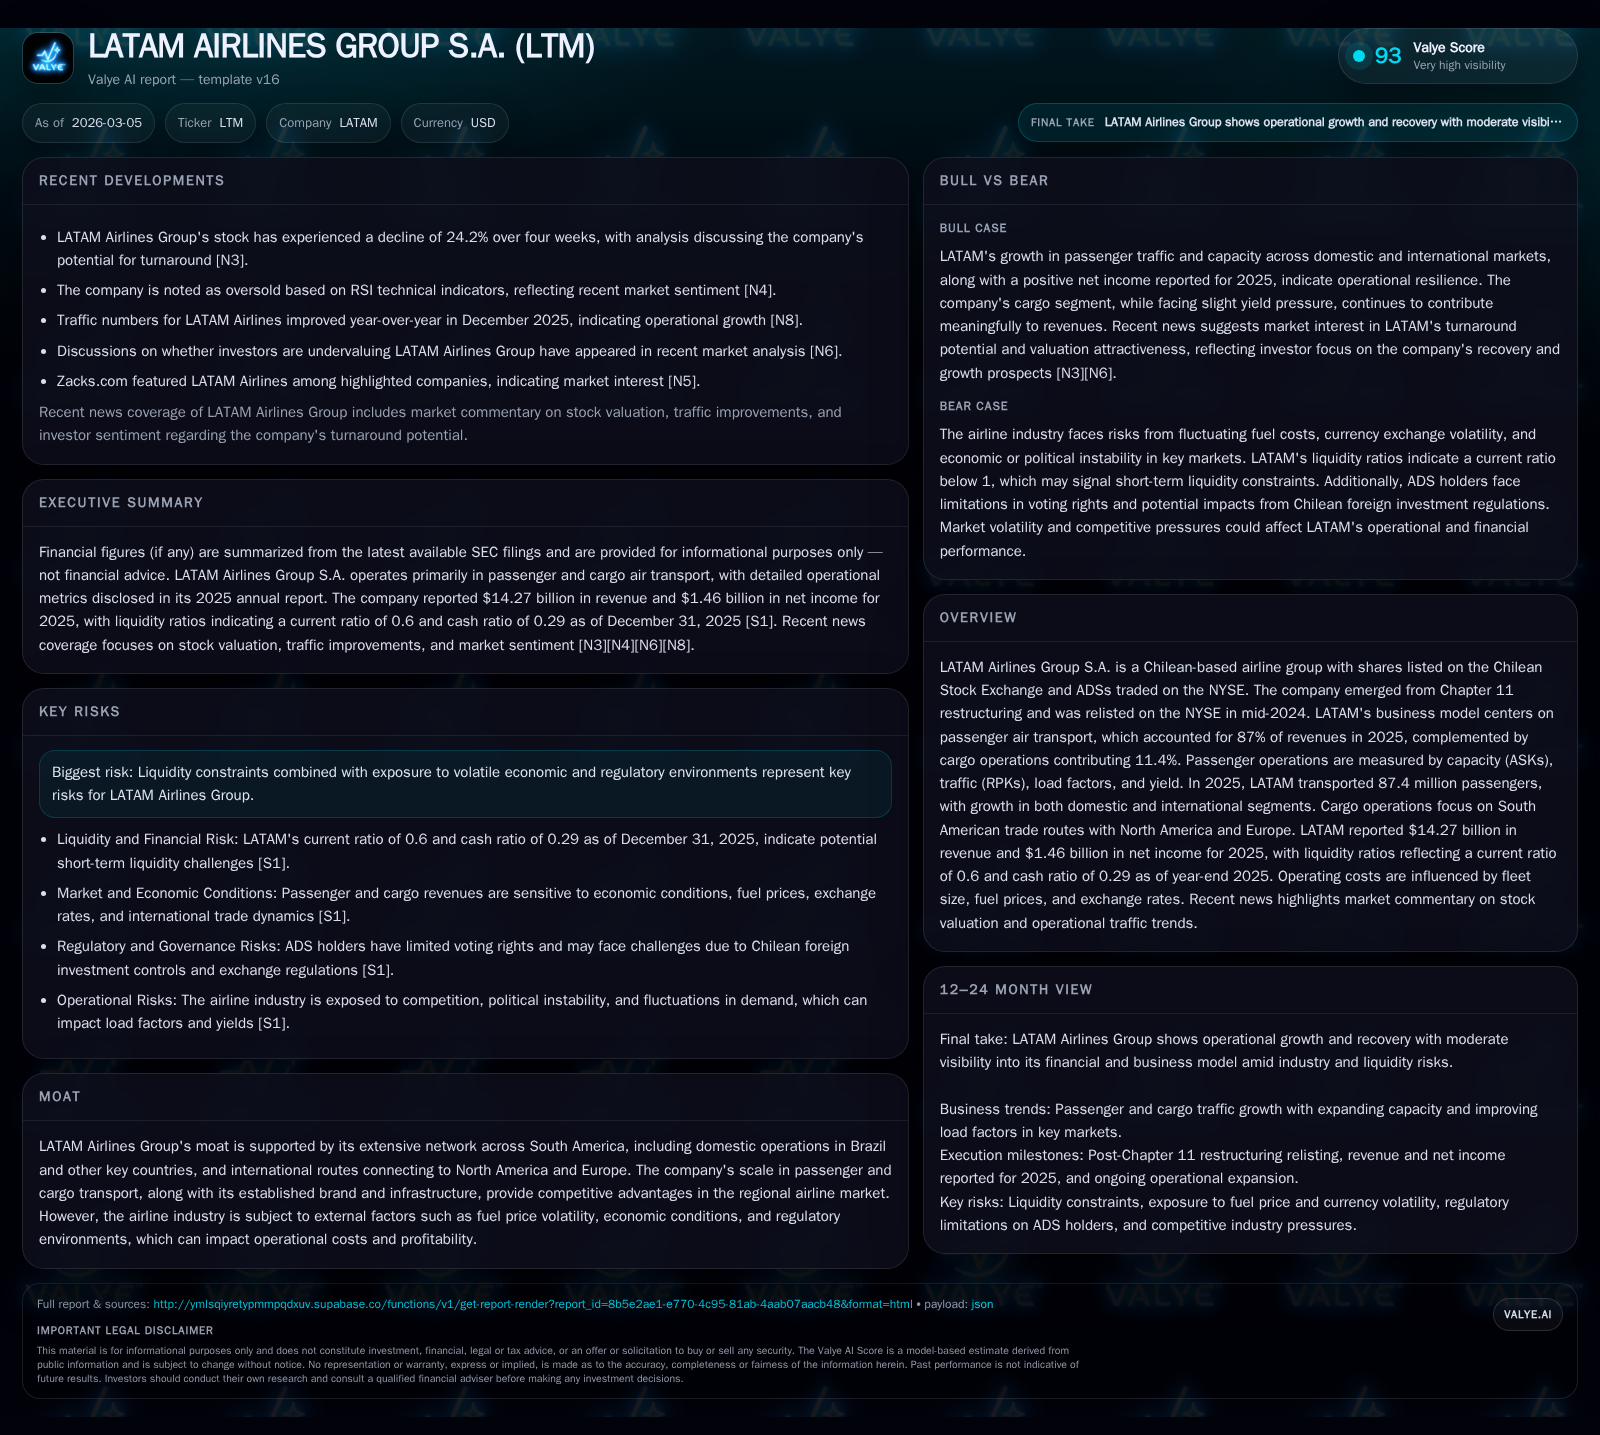
Following its emergence from Chapter 11 bankruptcy and relisting on the NYSE in mid-2024, LATAM Airlines Group posted robust operational and financial results in 2025. Passenger traffic surged to 87.4 million travelers, driven by capacity expansions especially in domestic Brazil and international routes. Cargo operations showed volume growth but faced yield pressures amid competitive trade corridors. Financially, the company managed liquidity tightly with extended credit facilities and disciplined debt refinancing, supporting increased dividends and fleet investments despite a current ratio below one. Going forward, LATAM’s performance hinges on managing rising personnel costs, fuel price volatility, currency fluctuations, and regulatory complexities across Latin America.
From Restructuring to Growth: LATAM’s Recent Performance Trajectory
LATAM Airlines Group's turnaround is marked by its emergence from Chapter 11 bankruptcy proceedings completed by late 2023 and relisting on the NYSE in July 2024 [S1]. In fiscal year 2025, the company demonstrated significant recovery through improved operational metrics and financial strength.
Revenue reached approximately $14.27 billion USD, an increase of 11.2% compared to $12.83 billion in 2024 [F1]. Net income rose nearly 50% year-over-year to about $1.46 billion from $977 million the prior year, highlighting improved profitability post-restructuring [F1]. Equity grew markedly from $711 million at end-2024 to roughly $1.34 billion at end-2025, reflecting enhanced capitalization [F1]. Passenger volumes climbed sharply with approximately 87.4 million passengers transported in 2025—up over five million from the previous year—underscoring strong demand recovery [S1].
Passenger Operations: Capacity Expansion and Demand Dynamics
Passenger revenues remained the primary contributor at around 87% of total revenues in FY2025 [S1]. Available Seat Kilometers (ASKs) expanded by about 8.2% to roughly 170.8 billion from about 157.9 billion in FY2024 [S1]. International capacity increased by approximately 10%, while Single South Cone (SSC) domestic markets experienced a slight decline (-0.6%) in ASKs [S1]. Meanwhile, LATAM Airlines Brazil saw robust domestic growth with ASKs up over +10%, supported by a stronger traffic increase (+12%), which lifted its load factor by +1.4 percentage points to about 83.8% [S1].
Corresponding Revenue Passenger Kilometers (RPKs) followed similar trends with international RPKs rising +8.6%, domestic Brazil +12%, and SSC markets showing stable or slightly positive performance [S1]. The international load factor dipped marginally (-1.1 p.p.), likely due to capacity outstripping demand during network adjustments; however, consolidated load factors held steady near 84.4% [S1].
Cargo Segment: Volume Growth Amid Yield Pressure
Cargo contributed approximately 11.4% of revenues in FY2025 with Available Ton Kilometers (ATKs) increasing roughly +3.1% while Revenue Ton Kilometers (RTKs) grew +2.2%, resulting in a cargo load factor decline to about 53.3% [S12]. Cargo yield decreased by around -1.1%, indicating some pricing pressure amid competitive trade routes connecting South America with North America and Europe [S12]. This reflects normalization after elevated cargo performance levels earlier.
LATAM’s cargo strategy leverages belly space on passenger aircraft alongside dedicated freighters servicing key corridors centered on Brazil as the primary import market [S12]. Maintaining yield resilience remains essential amid global trade dynamics.
Financial Position: Liquidity Management and Capital Structure
Post-bankruptcy, LATAM has actively managed liquidity through amended revolving credit facilities extended to July 2029 with increased capacities—$800 million for Revolving Credit Facility I and $750 million for Facility II—as well as a sustainability-linked Spare Engine Facility of $300 million maturing in late-2028 focused on emissions reduction targets [S4][S5][S13].
Cash and cash equivalents stood at approximately $2.15 billion at year-end 2025 with undrawn revolvers adding about $1.55 billion available liquidity—a critical buffer given the current ratio near 0.6 due to elevated current liabilities ($7.29 billion vs current assets ~$4.38 billion) [F1][S8].
Debt totaled around $4.3 billion nominal value comprising senior secured notes issued post-exit bearing coupons near mid-to-high single digits (~7.6%-7.9%), secured bank loans, tax leases, and other obligations—with roughly two-thirds at fixed or capped interest rates providing some cost stability [S6][S7][S13].
Loan repayments moderated following heavy deleveraging in prior periods though new issuances support fleet commitments alongside operating lease arrangements enhancing flexibility [S5][S6][S24].
Capital Allocation: Dividends, Fleet Investment, and Shareholder Returns
Reflecting earnings improvement, dividends increased notably from approximately $293 million in FY2024 to about $438 million in FY2025, signaling resumed shareholder distributions post-restructuring constraints [F1][S14]. Concurrently, share repurchase programs totaling around $585 million were executed enhancing capital returns though no ongoing buyback plans have been explicitly disclosed [F1][S14].
Fleet financing primarily involves long-term loans covering most purchase price (~85-100%) supplemented by sale-leaseback arrangements plus operational leases allowing capital efficiency while supporting network expansion [S5][S6][S14]. Capital expenditures net of financing amounted to roughly $1.45 billion for FY2025 driven by aircraft acquisitions, maintenance checks, cabin upgrades, technology enhancements aligned with growth plans; estimated annual CapEx net of financing is projected near $1.7 billion through at least FY2028 indicating sustained modernization efforts [S11][S23][S27].
Operational Outlook: Managing Costs and Market Conditions
Operational metrics warrant close monitoring as passenger yields softened somewhat despite overall revenue growth from increased traffic last year [N3][N10][S9][S10][S15]. Wage inflation remains a significant cost driver with personnel expenses rising about +15% reflecting higher headcount especially among cabin crew and ground staff despite productivity gains elsewhere [S9][S17][S22]. Load factors could face pressure if geopolitical events or local demand soften international travel.
Cargo segment profitability depends on maintaining competitive yields amid fluctuating trade volumes on transatlantic routes where LATAM’s hub advantages must be balanced against cost efficiency initiatives including sustainability-linked financing incentives promoting greener operations [N10][N13][N15][S18].
Fuel price volatility remains an overarching risk mitigated partially via hedging programs covering up to ~50% of consumption rolling into early-mid ‘26 periods per disclosures; fleet utilization optimization leveraging newer wide-body aircraft will be pivotal for controlling unit costs per ASK under these conditions [N3][S18].
Risks: Currency Exposure and Regulatory Complexity
Currency depreciation presents earnings translation risk given significant operating expenses denominated locally versus USD functional currency accounting; LATAM recorded a net foreign exchange loss near -$142 million for FY25 compared to gains prior year underscoring sensitivity requiring vigilant hedging strategies execution[S16].
Regulatory challenges include ADS holder voting limitations imposed through deposit agreements granting discretionary voting rights often favoring major shareholders impacting governance perceptions[S26]. Chilean market liquidity constraints add trading volatility risk warranting strategic investor relations focus[S26]. Fuel price exposure combined with regional competition dynamics demands continuous operational adaptation.[N3][N9][N13]
Key Metrics Summary Table: Revenue, Profitability and Capital Flow Trends
Historical performance (annual)
| FY | Rev ($bn) | Net ($mm) | Rev YoY | Net YoY |
|---|---|---|---|---|
| 2025 | 14.3 | 1464 | +11.2% | +49.7% |
| 2024 | 12.8 | 977 | +10.2% | +68.1% |
| 2023 | 11.6 | 582 | +24.3% | -56.5% |
| 2022 | 9.4 | 1337 |
Source: SEC companyfacts cache [F1].
Capital returns and efficiency (annual)
| FY | Div ($mm) | ROE% |
|---|---|---|
| 2025 | 438 | 109.4 |
| 2024 | 293 | 137.4 |
| 2023 | 175 | 132.7 |
| 2022 | 4352.5 |
Source: SEC companyfacts cache [F1]. This table distills LATAM’s rapid top-line expansion alongside strong profitability gains following restructuring coupled with expanding equity base supporting dividend ramp-ups despite working capital constraints.
Disclaimer: This report is prepared solely for informational purposes based on company filings as of early-2026 without investment advice or recommendations.
Disclaimer: This is research-only, informational analysis and not investment advice. It may include AI-generated interpretation and general industry context. Always verify important details using primary sources.
Comments