
Las Vegas Sands Navigates Q2 2026 Revenue Miss Amid Strong Resort Portfolio and Capital Strategy
Q2 2026 results reflect mixed operational trends and active debt refinancing within a capital-intensive integrated resort industry.
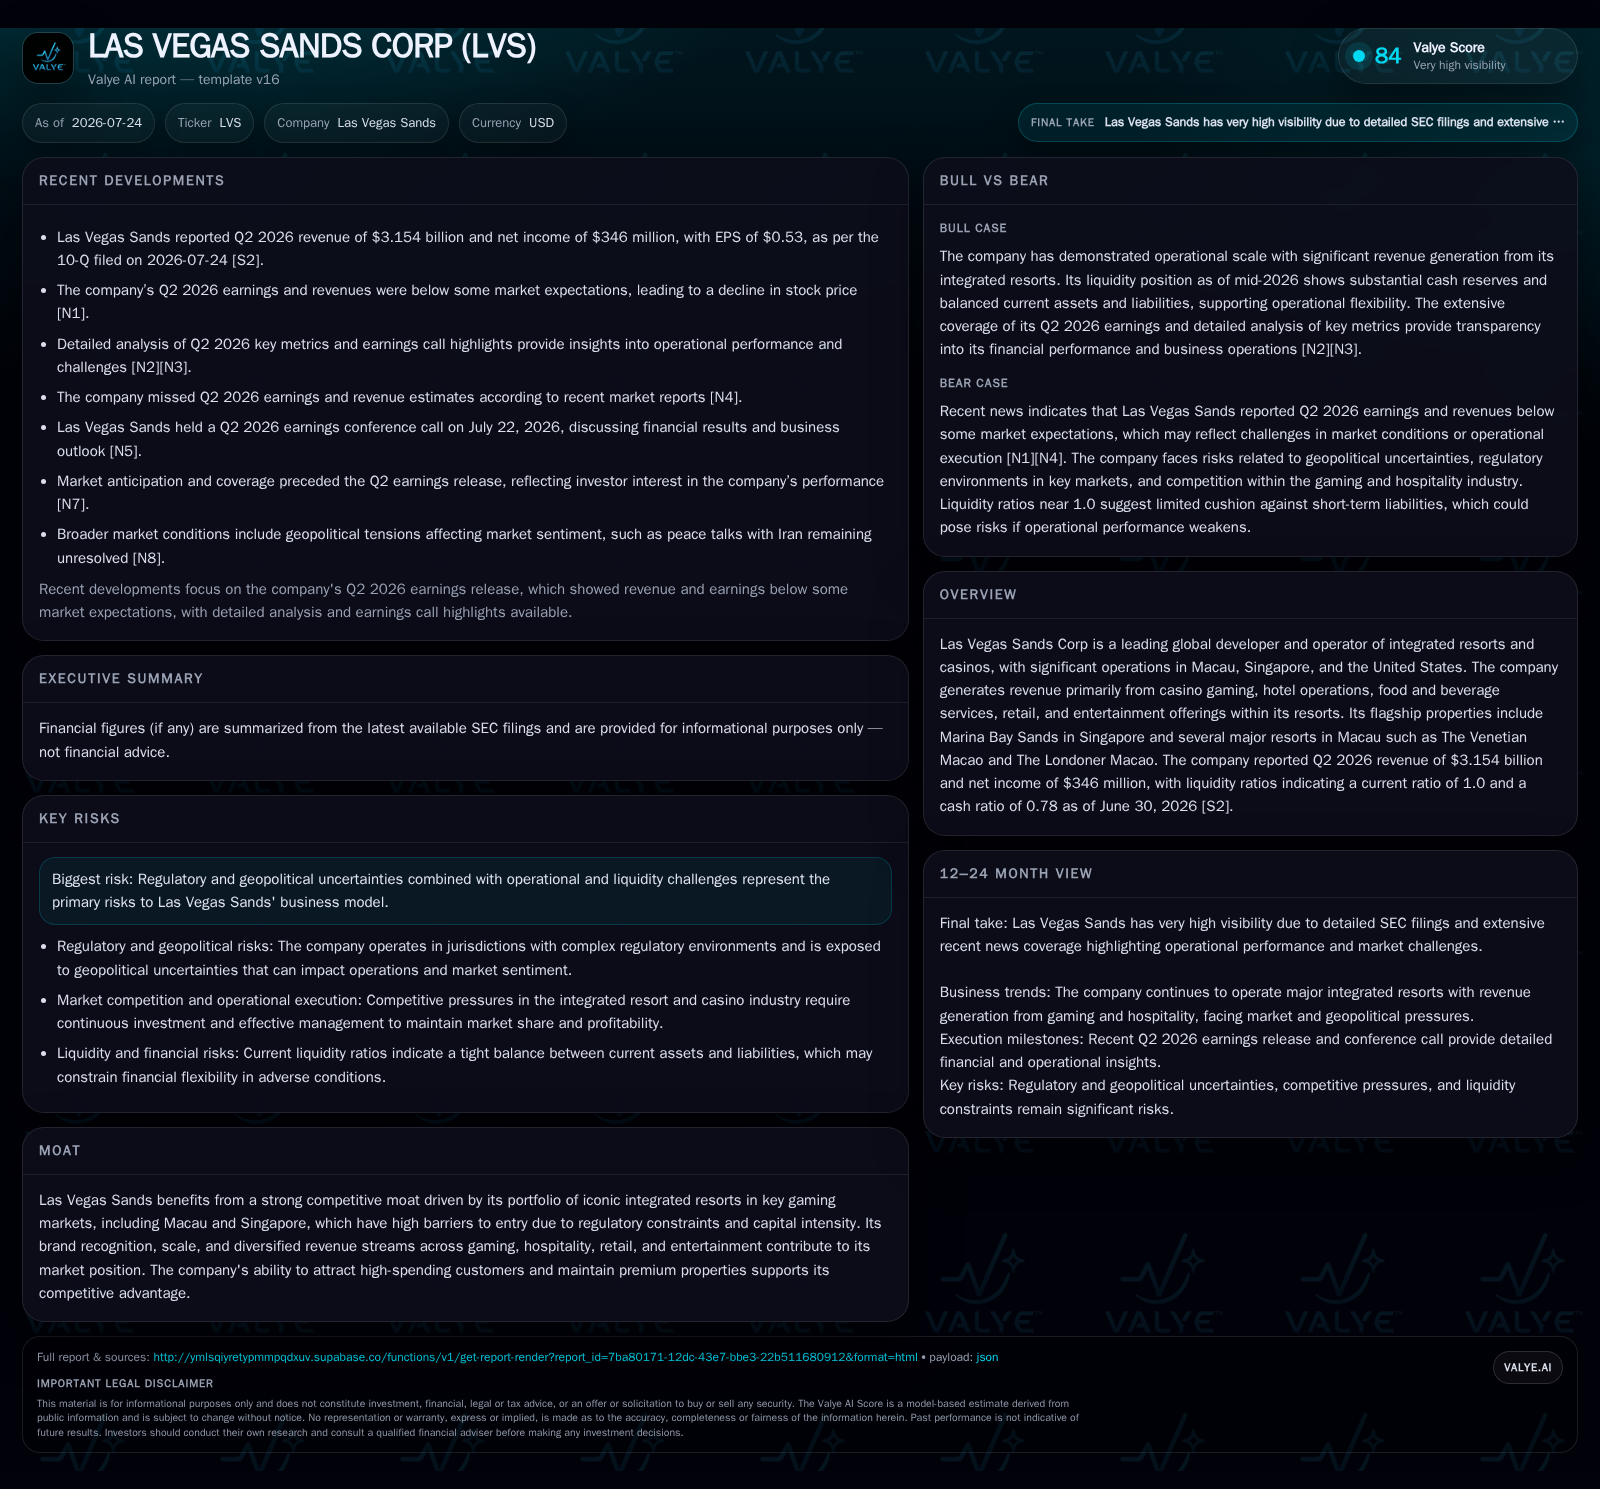
Las Vegas Sands Corp reported second-quarter 2026 revenue of $3.15 billion and net income of $346 million, slightly missing expectations and reflecting some softness in casino revenues despite continuing strength in hospitality and retail segments [S2][N1]. The company’s portfolio, anchored by marquee properties in Macau and Singapore, maintains competitive advantages through scale, diversified revenue streams, and regulatory moats [S1]. Recent debt refinancing optimized interest costs and maturity profiles but total leverage remains elevated in this capital-heavy industry [S2][S5]. Macroeconomic pressures and geopolitical uncertainties pose ongoing risks to visitation and gaming demand. Key near-term monitors include recovery trends in Macau GGR, hotel occupancy rates, execution of expansion projects, and liquidity metrics [S3][S16].
Recent Operating Update
Las Vegas Sands Corp’s latest quarterly filing for Q2 ended June 30, 2026 reveals nuanced operational performance dynamics reflective of the volatile integrated resorts sector. The company reported net revenues of $3.154 billion, marginally below last year’s $3.175 billion figure as casino revenues softened from $2.415 billion to $2.341 billion despite some growth noted in hotel rooms rents ($359 million vs. $345 million) and mall leasing ($198 million vs. $187 million) segments [S2][N1]. Net income stood at a solid $346 million but below analyst expectations driven by higher operating expenses including marketing investments aimed at customer re-engagement after years of pandemic disruptions.
A notable liquidity event during the quarter was the early full repayment of a seller financing loan stemming from the sale of LVS’s Las Vegas real estate operations totaling $1.26 billion which added interest income of approximately $20 million through June 30 [S2]. This inflow bolsters near-term cash flexibility in an otherwise capital-demanding environment.
Meanwhile, strategic refinancing moves included issuing two tranches of senior unsecured notes aggregating $1 billion with coupons at 5.3% (due 2031) and 5.65% (due 2033), replacing maturing lower-rate debt thereby extending maturity profile but increasing weighted average cost of debt given rising interest rate cycles globally [S2][S5]. LVS also retains a significant revolving credit facility balance enhancing liquidity buffers.
Business Model Overview
Las Vegas Sands operates as one of the world’s largest integrated resort developers and operators with flagship properties including Marina Bay Sands (Singapore) alongside major Macau assets - Venetian Macao, Londoner Macao, Parisian Macao, Sands Macao - generating diversified revenue streams. The core profit engine revolves around casino gaming comprising table games and slot machines targeting retail customers alongside high rollers (‘VIP’ or ‘premium players’), complemented by hotel room rentals charged at premiums driven by location appeal and luxury services.
Revenue diversification into ancillary hospitality components such as food & beverage outlets, retail leasing within integrated malls, convention centers, and entertainment events stabilizes cash flow against cyclical gaming swings typical of discretionary spend sectors [S1]. This multi-segment approach spreads operational risk while adding customer lifetime value through cross-selling opportunities.
Monetization relies heavily on gross gaming revenue (GGR), with casino win rate variability directly impacting top-line alongside hotel occupancy rates and average daily room rates that reflect market demand elasticity. Retail tenancy mix and occupancy rates contribute steadily to steady-state revenue given long-term lease contracts with safeguards.
Customer acquisition and retention efforts are anchored in premium player programs targeted at high-spending clients capable of generating outsized margin contributions despite their smaller volume share. Operational margin analysis suggests casino segments carry different cost structures relative to hotel or retail units reflecting labor intensity, capital depreciation, amortization schedules for property development costs, and marketing spend efficiency.
Industry Structure and Competitive Positioning
The integrated resorts industry is characterized by a high capital investment threshold with licensing regulated tightly in key jurisdictions like Macau — which requires government concessions renewing periodically — Singapore — where limited land parcels constrain new entrants — and US markets where local regulatory compliance governs operations strictly.
Within this framework LVS benefits from strong competitive moats: ownership of iconic large-scale destinations supported by powerful brand recognition; ability to attract international tourism including Asian VIP gamblers who contribute meaningful GGR percentages; diversified revenue mix cushioning pure-play casino cyclicality; plus scale advantages supporting superior pricing power for hotel room bookings and retail leases compared to smaller players.
Peers such as MGM Resorts International, Wynn Resorts, Melco Resorts & Entertainment also compete on property quality upgrades but LVS’s emphasis on mega-integrated resorts with sizeable non-gaming amenities presents differentiation amidst tightening discretionary consumer spending patterns post-COVID recovery cycles.
Macro risks such as geopolitical frictions affecting cross-border travel into Macau and Singapore remain acute threats along with potential regulatory clampdowns on lending associated with VIP players or gaming license renewal processes potentially constraining growth without nimble government relations management.
Growth Drivers
Key growth levers include continued rebound in outbound Asian tourism fueling incremental visitation to Macau properties where LVS holds multiple prime resort assets stimulated by government policies easing travel restrictions post-pandemic. Expansion initiatives at Marina Bay Sands involving additional gaming floors combined with enhanced entertainment offerings aim to capture broader market shares beyond traditional gamblers.
Sophisticated customer loyalty programs tailored toward premium players improve repeat visitation frequency while driving higher spend per visit across gaming floors plus ancillary services such as F&B outlets or exclusive events. Technological integration—like mobile check-ins or data-driven personalized marketing—enhances guest experience competitiveness crucial for long-term retention.
Non-gaming diversification through retail mall tenancy optimization improves yield stability while convention center usage expands corporate segment penetration adding demand cyclicality buffers.
Risks and Constraints
Operational constraints stem largely from hefty fixed costs embedded within property maintenance requirements alongside elevated labor expenses in hospitality management exerting pressure on margins during periods of softening revenues. Inflationary trends across utilities or supply chains could exacerbate cost inflation absent offsetting pricing power.
Regulatory dynamics pose significant watchpoints: Macau concession renewals scheduled every decade involve political sensitivities that may impact future operating licenses materially altering market competitive equilibrium. Likewise currency exchange fluctuations between HKD/USD/SGD introduce translation volatility impacting consolidated earnings.
Geopolitical tensions dampening mainland China visitation—the largest source market—remains a wildcard affecting foot traffic volumes crucial for sustaining slot machine sales dominance. Pandemic recurrence or global health scares could trigger abrupt downturns akin to prior years.
Financial leverage risks emerge from maintaining over $15 billion outstanding debt alongside liquidity cushions exceeding $3.3 billion and access to sizable revolving credit lines reflecting necessary financial prudence within this capital-heavy model [F1][S2]. Interest rate hikes elevate servicing expenses necessitating effective refinancing strategies.
What To Watch Next
Near term milestones focus on Q3 earnings reports highlighting sequential recovery trajectories particularly comparing Macau’s gross gaming revenue metrics against Shanghai's reopening effects measured through concrete KPIs like gaming floor utilization rates plus average daily room rentals evidencing occupancy health [N3][S16]
Progress updates related to expansion projects at Marina Bay Sands or other Asian assets will signal management execution capabilities validating capital expenditure ROI assumptions stated previously [S1]
Financially monitoring liquidity ratios post recent debt refinancing will provide insight into continued balance sheet robustness amid elevated leverage context including tracking free cash flow generation for discretionary capital returns or further deleveraging [S5]. Monitoring competitor pricing actions across US resorts holds relevance given potential market share shifts impacting LVS’s cross-geography revenue mix stability.
Management commentary on emerging regulatory developments particularly regarding Macau gaming license frameworks will be critical given their outsized business impact stakes.
Financial Profile Discussion
As of June 30, 2026, Las Vegas Sands reported cash and equivalents totaling approximately $3.38 billion against total debt obligations of about $15.25 billion, resulting in net debt near $11.88 billion [F1]. Recent bond issuances replaced maturing lower coupon notes, extending maturities and increasing weighted average interest costs consistent with prevailing credit market conditions [S2]. The company maintains access to revolving credit facilities enhancing liquidity buffers.
Current assets and current liabilities were roughly balanced at $4.3 billion each as of June 30, 2026, indicating a current ratio near 1x [F1]. This reflects typical working capital dynamics for integrated resorts with capital-intensive operations and ongoing investment cycles.
Net income generation remains solid though somewhat pressured by elevated marketing spend aimed at restoring premium player engagement levels supporting medium-term top-line goals despite near-term quarterly softness seen in Q2 revenue comparisons versus 2025 benchmarks [N1][N2]. Maintaining free cash flow positivity against scheduled CapEx plans including refurbishments will be essential for augmenting liquidity buffers without excessive incremental borrowings.
In summary: LVS maintains financial flexibility consistent with its stature among global mega-resort operators yet must vigilantly manage balance sheet leverage against volatile operational environments sensitive to macroeconomic shifts affecting discretionary consumer spending behaviors worldwide.
Disclaimer: This is research-only, informational analysis and not investment advice. It may include AI-generated interpretation and general industry context. Always verify important details using primary sources.

Comments