
3M’s Diversification, Margin Recovery, and the Challenge of Sustaining Innovation-Led Growth
With Q3 2026 results showing revenue acceleration and margin improvement, 3M’s multi-segment model is delivering operational gains. The question is whether patent-driven innovation and supply-chain discipline can offset rising regulatory and competitive headwinds in the next cycle.
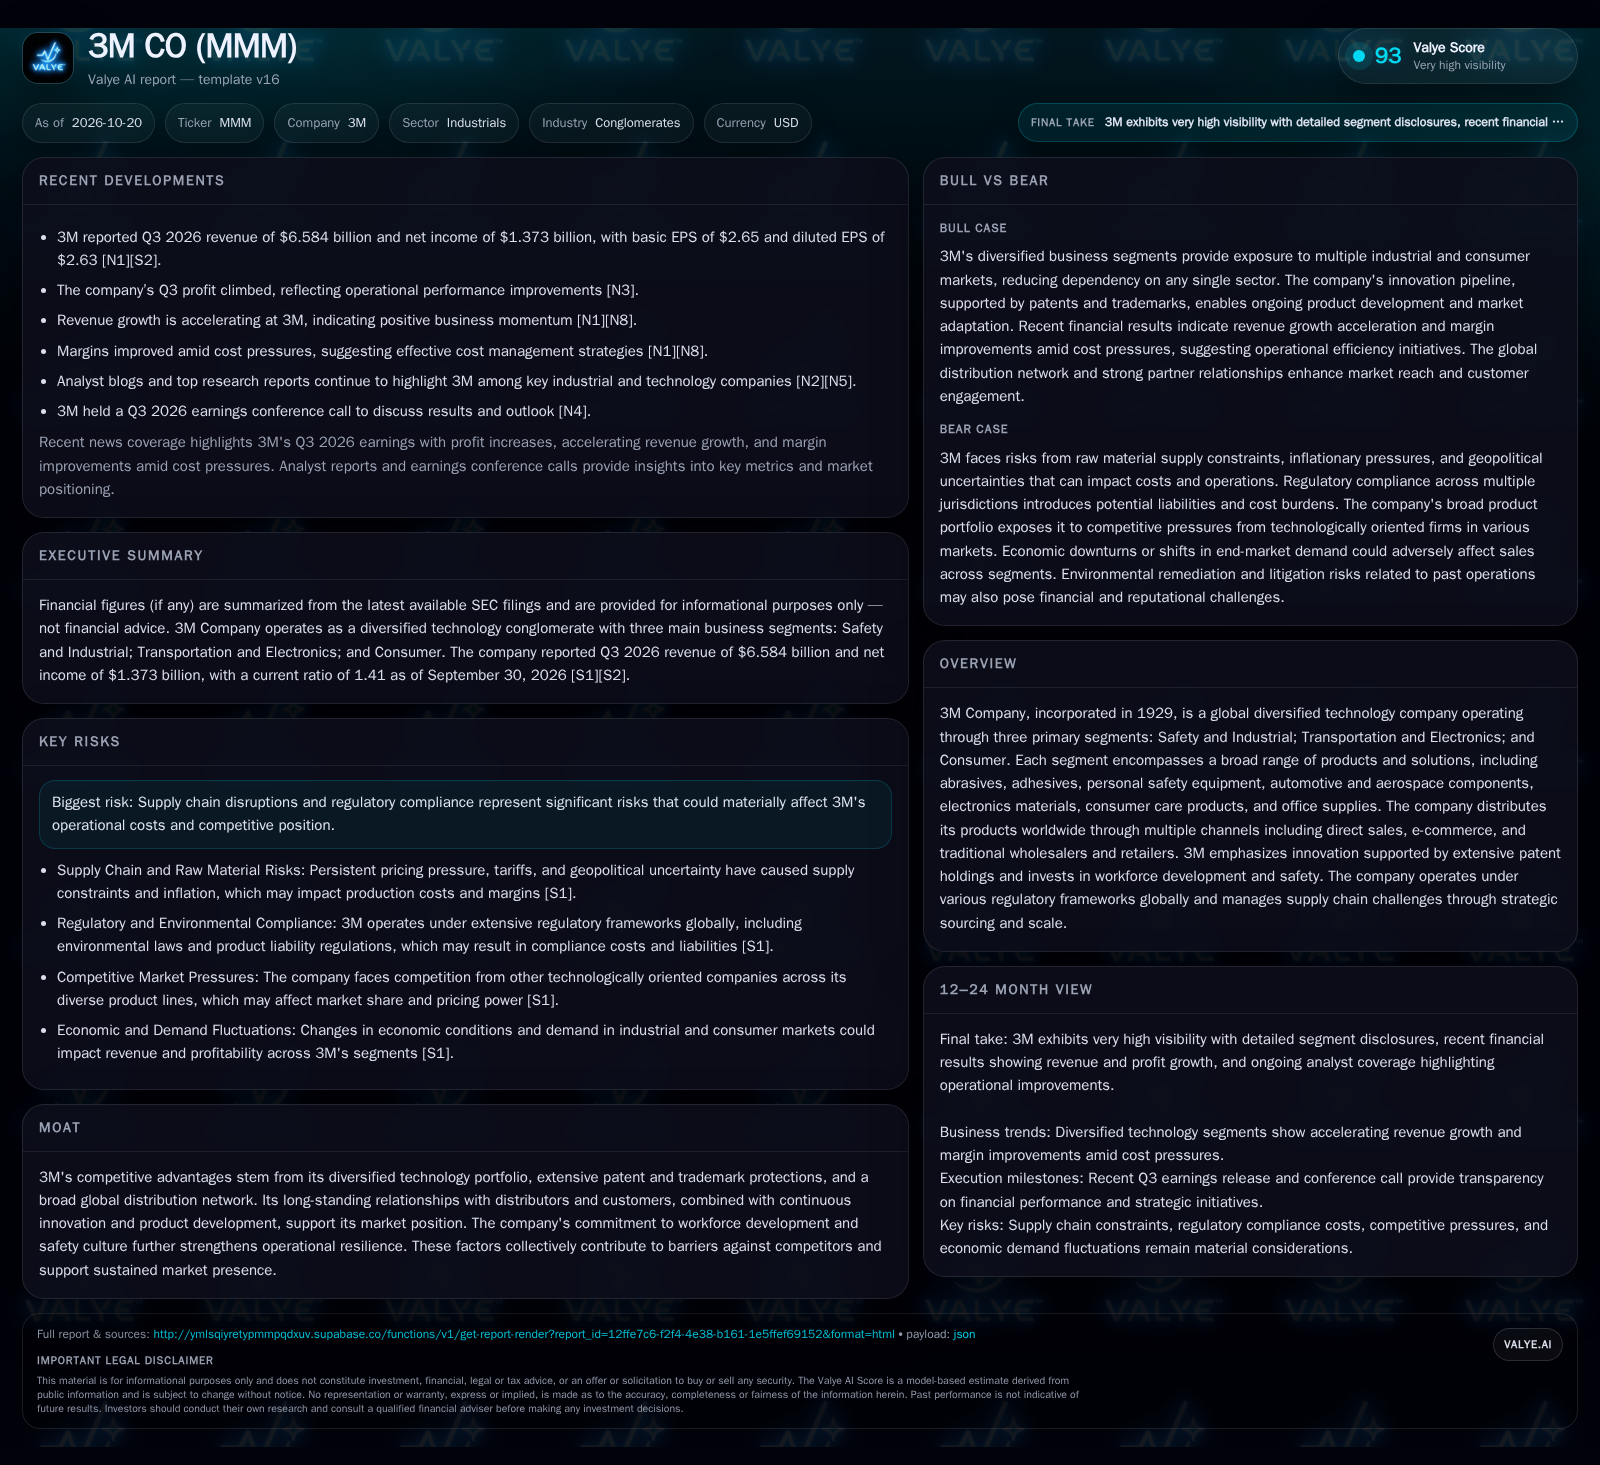
3M reported Q3 2026 revenue of $6.584 billion and net income of $1.373 billion, with margin improvements despite ongoing cost pressures [S2] [N1] [N8]. The company’s diversified segment structure, robust patent portfolio, and global reach underpin recent growth, but persistent supply chain constraints, regulatory burdens, and competition from tech-focused peers remain material risks [S1] [S2]. The durability of 3M’s margin rebound will depend on its ability to innovate, manage input costs, and defend share across mature and emerging product categories.
3M’s latest quarterly results reveal a company in the midst of operational recovery, with revenue and profits climbing even as macro headwinds persist. The diversified nature of its portfolio—spanning industrial, transportation, electronics, and consumer markets—has buffered 3M from shocks in any one sector. However, the margin gains and revenue acceleration achieved in Q3 2026 will be tested by persistent supply chain and regulatory challenges, as well as intensifying competition from both established and emerging technology players. The durability of 3M’s innovation engine and its ability to manage costs at scale are now central to the next phase of value creation.
Recent Gains: Margin Expansion and Accelerating Revenue in Q3 2026
3M posted Q3 2026 revenue of $6.584 billion and net income of $1.373 billion, with basic EPS of $2.65 and diluted EPS of $2.63 [S2]. These results were accompanied by margin improvements, achieved despite ongoing inflation and raw material supply constraints [N1] [N8]. The company reported cash and liquidity metrics for the period; these figures do not by themselves establish operating runway, investment capacity, financial flexibility, or financing capacity. [S2] The acceleration in revenue growth and profit recovery signals that 3M’s operational adjustments and cost management initiatives are yielding tangible benefits, at least in the near term.
How 3M’s Diverse Portfolio and Scale Shape Its Economic Model
3M’s business model is built on a broad portfolio that spans Safety and Industrial, Transportation and Electronics, and Consumer segments [S1]. This diversification helps smooth out cyclical swings in any one end market and allows the company to allocate resources dynamically. Revenue is generated through a mix of direct sales, e-commerce, and traditional distributor and retail channels, with product offerings ranging from high-volume consumables (like adhesives and tapes) to specialized solutions for industrial and electronics markets.
Pricing power in mature categories is often modest due to competition and substitution risk, but 3M seeks to offset this through differentiated innovation, protected by a deep patent portfolio [S1]. This enables premium pricing for new or high-performance products, at least until competitors catch up. Variable costs—especially raw materials—are a major driver of margin volatility, but 3M’s scale and negotiated supply contracts can partially mitigate these swings [S1].
Operating leverage is moderate across segments: fixed costs are spread over a large product base, so incremental volume growth can drive outsized margin gains. However, capital needs remain substantial for manufacturing, compliance, and R&D, requiring careful allocation to avoid margin dilution. Sustaining high returns depends on continual product refreshes and the ability to manage input cost inflation more effectively than peers.
Innovation, Patents, and Supply Chain Discipline: 3M’s Defenses and Exposures
3M’s competitive strengths rest on its diversified technology base, extensive U.S. and foreign patents, and a global distribution network [S1]. Patents can provide a temporary moat for new product introductions, allowing 3M to capture higher margins while limiting direct imitation. Its long-standing customer and distributor relationships create friction for competitors seeking to displace entrenched products.
However, the breadth of 3M’s portfolio also means exposure to intense competition across a range of categories—from large industrial conglomerates to agile, tech-focused entrants. In electronics and specialty materials, technology cycles are shortening, and switching costs for customers may be lower than in traditional industrial consumables. Regulatory scrutiny, especially around product safety and environmental liability, is rising and could erode advantages if compliance costs escalate [S1].
Substitution threats are real in commoditized segments, while in high-value niches, 3M’s ability to sustain a premium depends on the pace of innovation and the effectiveness of its IP enforcement. The company’s scale is a double-edged sword: it supports bargaining power and efficient logistics but makes rapid portfolio shifts more difficult if market dynamics change.
Innovation-Led Growth: What an Outperformance Cycle Could Look Like
An upside scenario would see 3M leveraging its R&D and patent portfolio to launch differentiated products that command premium pricing, especially in high-growth verticals like electronics and advanced materials. If supply chain management continues to blunt the impact of raw material inflation, and if cost discipline holds, incremental volume gains could drive further margin expansion.
Acceleration in revenue would likely be confirmed by sustained above-market growth in one or more business segments, with new product introductions gaining rapid adoption. Evidence would include rising gross margins (despite input cost headwinds), increased proportion of sales from recently launched products, and higher R&D efficiency (e.g., more patents granted per dollar spent). Analyst commentary highlighting share gains in targeted categories and a declining ratio of compliance costs to sales would further validate this scenario.
Maintaining Momentum Amid Persistent Cost and Regulatory Pressures
The most plausible outcome is that 3M continues to grow in line with global industrial and consumer demand, using its diversified segments to buffer volatility. Margins may remain stable or improve incrementally as operational improvements offset ongoing inflation and supply chain pressures. Product innovation sustains competitive position, but pricing power is limited by mature category dynamics and periodic substitution.
This scenario would be confirmed by steady revenue growth across all segments, stable or slightly expanding operating margins, and a manageable level of compliance and litigation costs. If raw material inflation intensifies or new regulatory burdens emerge, margin progress could stall, but the company’s scale and channel diversity would likely help it avoid sharp declines. Evidence would include segment-level revenue and margin stability, and commentary from management or analysts indicating continued operational discipline.
Margin Compression from Input Cost Surges or Regulatory Shocks
A downside scenario could unfold if raw material inflation accelerates, supply chain disruptions persist, or regulatory actions (including environmental liabilities or product recalls) impose significant new costs. In this case, 3M’s fixed cost base could magnify the impact of even modest revenue declines, leading to margin compression and profit erosion.
This would be confirmed by sequential declines in gross and operating margins, rising SG&A or legal expenses as a share of revenue, and warnings from management about cost headwinds or unresolved litigation. Market share losses in key categories, or evidence of price concessions to retain major customers, would further signal deteriorating competitive position. Negative analyst revisions or increased credit spreads could follow if these pressures appear structural rather than temporary.
Milestones and Metrics That Will Determine the Durability of 3M’s Margin Recovery
Growth in revenue and operating margin by segment, especially the proportion attributable to new product introductions, would help gauge the health of 3M’s innovation cycle.
If disclosed, the ratio of R&D spend to sales and the number of new patents granted per year would indicate whether investment in innovation is translating into defensible differentiation.
Trends in raw material and logistics costs as a percentage of revenue, and management’s commentary on supply chain disruptions or contract renegotiations, will be critical for margin outlook.
Progress in resolving major regulatory, environmental, or product liability matters—quantified by legal expenses or settlement disclosures—would clarify the risk of future cost shocks.
Market share data in core industrial and electronics categories (if disclosed) would show whether 3M is holding ground against competitors or ceding share in key growth markets.
The evolution of the company’s global distribution channel mix—such as growth in direct-to-customer or e-commerce sales—could signal changing customer behavior and margin potential.
Disclaimer: This is research-only, informational analysis and not investment advice. It may include AI-generated interpretation and general industry context. Always verify important details using primary sources.

Comments