
Marten Transport's Transition to Multi-Segment Operations Challenges Growth and Margins in 2025
Marten Transport navigates a strategic shift while confronting industry headwinds and customer concentration risks.
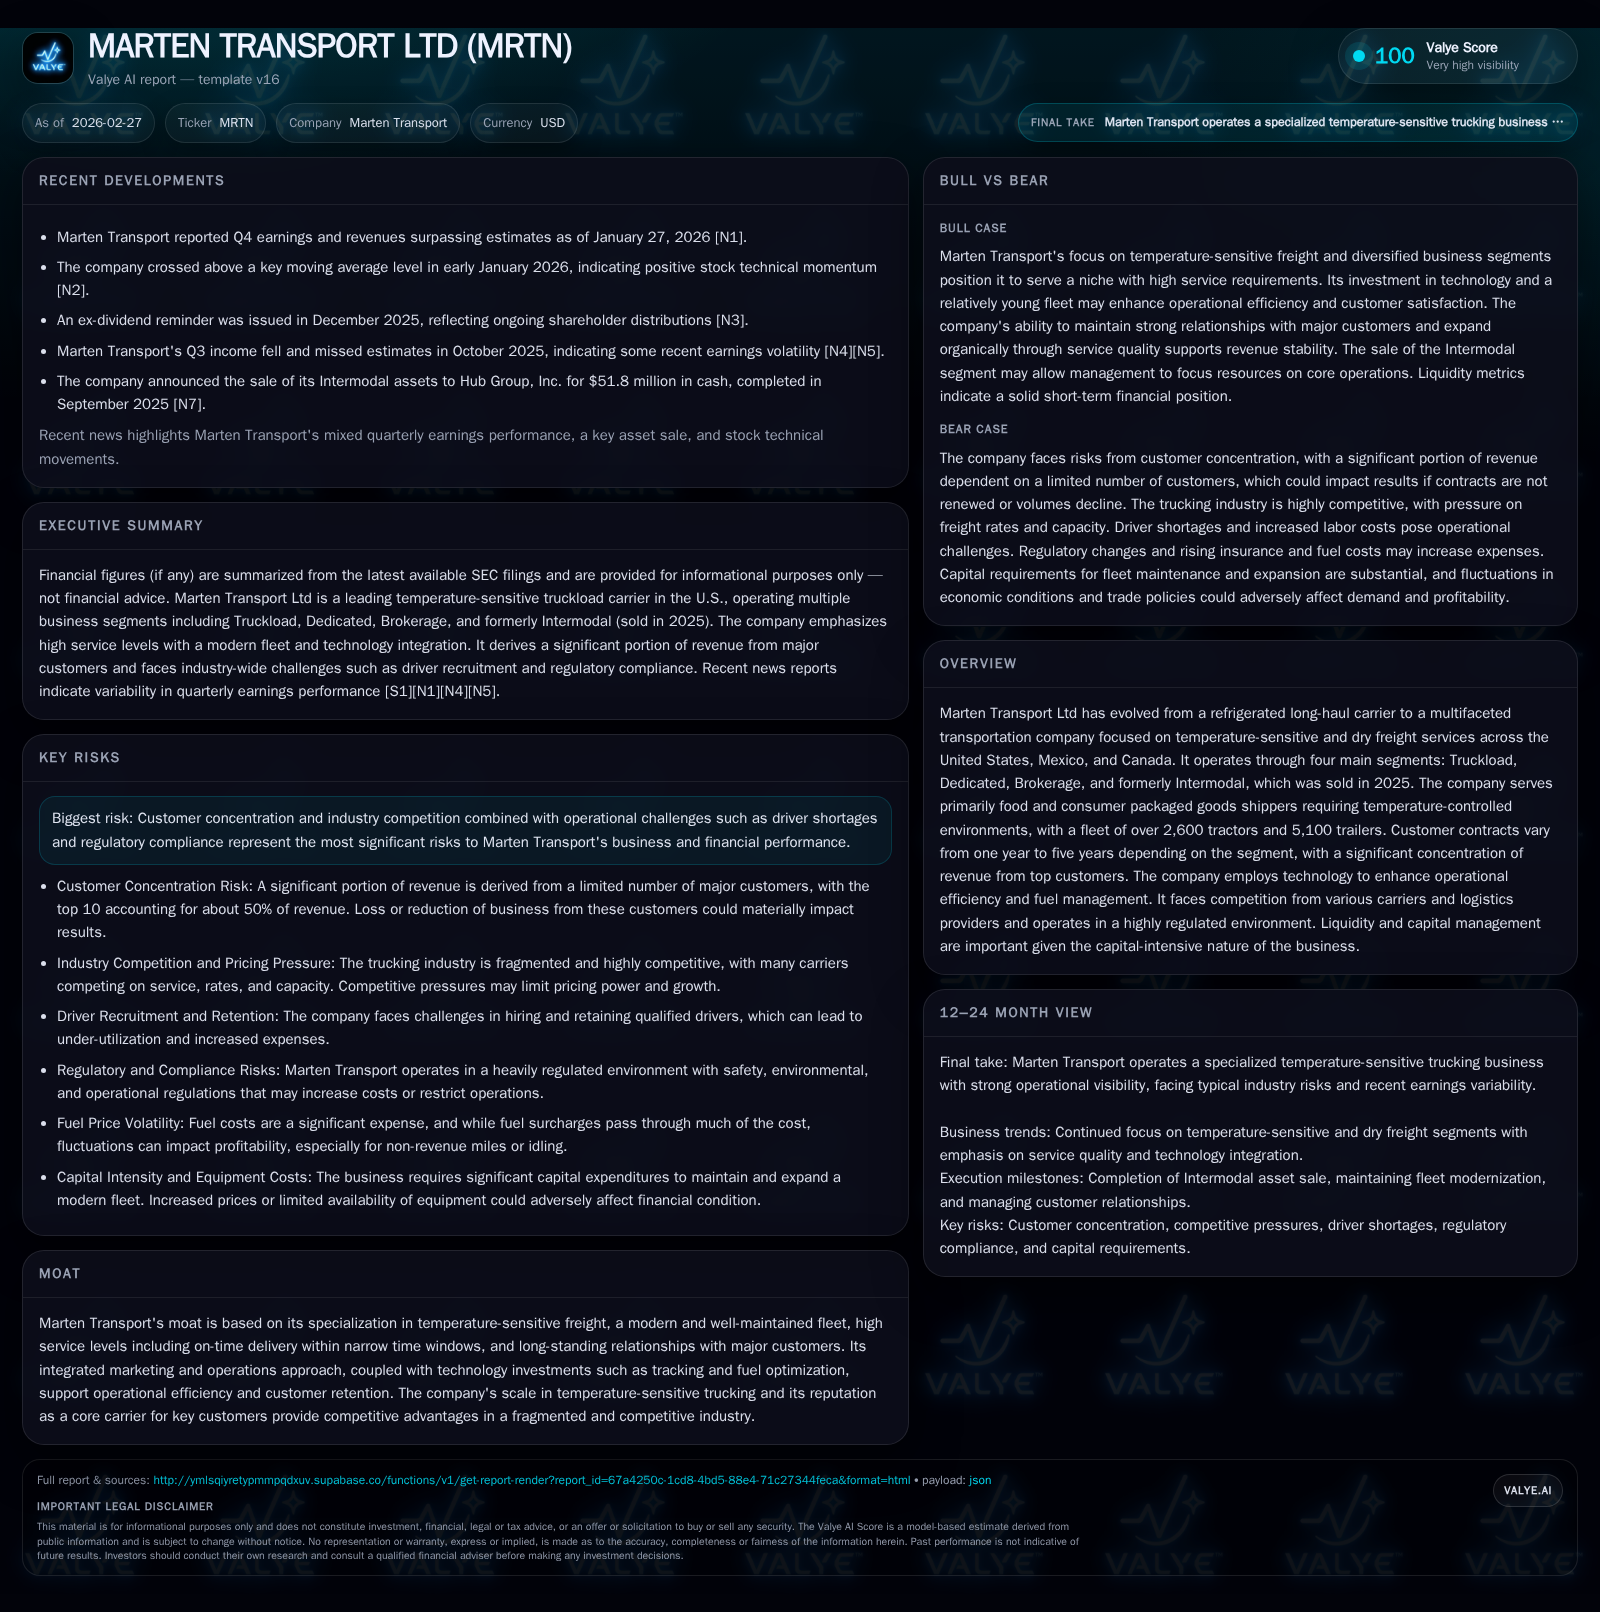
Marten Transport Ltd has evolved from a refrigerated long-haul carrier into a diversified transportation services provider focused on temperature-sensitive and dry freight across North America. While 2025 saw the divestment of its Intermodal segment, revenue contracted approximately 10.5% year-over-year amid ongoing economic pressures and tariff-related uncertainty. Despite generating positive operating income of $22.9 million in 2025, this marked a sizeable decline compared to prior years, reflecting margin compression and competitive pricing pressures. The firm maintains strong operational efficiency through technology investments and a well-maintained fleet, serving primarily food and consumer packaged goods shippers under medium-term contracts. However, heavy reliance on top customers, driver shortages, and regulatory challenges continue to shape the company’s risk landscape. Capital allocation has favored liquidity preservation, with limited share repurchases and consistent cash flow generation supporting financial stability.
Company Evolution and Market Positioning
Since its founding origins as a refrigerated long-haul carrier, Marten Transport Ltd has systematically diversified its operations across multiple truck-based segments—Truckload, Dedicated, Brokerage—and until recently Intermodal services within North America [S1][S6]. This strategic pivot supports offering shippers specialized temperature-controlled transportation alongside dry freight capabilities across key U.S., Canadian, and Mexican corridors.
The company's fleet comprises over 2,600 tractors and roughly 5,100 trailers focused on maintaining modernity and reliability conducive to servicing perishable goods which require stringent time and temperature controls [S4][S6]. Marten serves primarily food producers and consumer packaged goods companies who demand high service levels including delivery within tight scheduling windows [S6].
Historical Financial Performance
Marten's revenue reflected volatility tied to both strategic portfolio adjustments and broader market headwinds through recent years. After a substantial revenue recovery post-2020's pandemic slump ($227 million), top-line peaked near $1.26 billion in 2022 before retracting again to approximate levels slightly below $900 million in 2025—an approximate -10.5% compound contraction attributable largely to the divestment of its Intermodal assets plus softening demand amid tariff-led trade uncertainties [F1][S9].
Operating income displayed sharper fluctuations from $143 million in 2022 down to just over $22 million in the most recent fiscal year—a sign of eroded margins linked to intense competition, rising input costs (notably fuel despite surcharge mechanisms), and cost inflation [F1][S23]. Net income trends broadly mirrored this pattern leading to diminishing returns.
Historical performance (annual)
| FY | Rev ($mm) | Net ($mm) | CFO ($mm) | OpInc ($mm) | Rev YoY | Net YoY |
|---|---|---|---|---|---|---|
| 2025 | 17 | 93 | 23 | -35.2% | ||
| 2024 | 27 | 135 | 33 | -61.7% | ||
| 2023 | 1131 | 70 | 164 | 90 | -10.5% | -36.2% |
| 2022 | 1264 | 110 | 219 | 143 | +29.8% |
Source: SEC companyfacts cache [F1].
Capital returns and efficiency (annual)
| FY | Buybacks ($mm) | ROE% |
|---|---|---|
| 2025 | 2.3 | |
| 2024 | 0 | 3.5 |
| 2023 | 0 | 9.3 |
| 2022 | 42 | 15.7 |
Source: SEC companyfacts cache [F1].
*Estimate based on available data excluding Intermodal divestiture impact.
Operating Segments: Revenue Mix & Margins
Following the sale of its Intermodal operations effective September 30, 2025 [S9], Marten's core business focuses on:
- Truckload: Regional short-haul and medium-to-long-haul full-load transportation services primarily for temperature-controlled or dry freight across North America; typical agreements are one year.
- Dedicated: Customized transportation solutions with contracts ranging three to five years subject to annual rate reviews.
- Brokerage: Contractual relationships arranging third-party carrier transport under Marten’s management.
Approximately 59% of combined Truckload and Dedicated revenues derive from temperature-sensitive products with the remainder from dry freight [S6][S11]. Operating income is concentrated more favorably within Dedicated services consistent with longer-term contractual stability [F1][S23].
Growth Strategy & Operational Initiatives
Marten emphasizes organic expansion targeting shippers requiring reliable volumes rather than competing solely on price [S6][S12]. It aims for deeper integration as a core carrier with longstanding clients such as Walmart contributing around one-fifth of total revenues in 2025 [S6][S16].
Technology investments include terrestrial-based tracking for better load visibility, electronic logging devices ensuring regulatory compliance, fuel-routing software optimizing consumption, and auxiliary power units reducing idle fuel use—all supporting asset utilization efficiencies highlighted by a low non-revenue mile percentage (~7.3%) [S4][S12].
Challenges remain from economic softness affecting shipment volumes, tariff uncertainties impacting cross-border trade [S1][S15], tight driver labor markets increasing wage pressure despite competitive pay frameworks, and customer concentration risks given short contract terms or potential private fleet expansions [S16].
Outlook & Key Milestones
While explicit forward guidance is not provided publicly [N1][S3], critical factors include:
- Renewal rates among major customers,
- Pricing pass-through effectiveness amid fuel price volatility,
- Margin improvements via operational efficiencies,
- Brokerage segment growth potential,
- Potential new partnerships or acquisitions replacing divested intermodal capabilities.
Industry freight trends within specialized temperature-sensitive channels versus broader trucking metrics may also influence outlook.
Returns & Capital Allocation
Marten generated strong operating cash flow of approximately $93.5 million in FY25 after reduced capital expenditures compared to prior periods [F1], supporting solid liquidity with a current ratio near 1.86 [F1][S18]. Equity rose modestly above $767 million reflecting retained earnings accumulation despite lower net income [F1].
Capital deployment favors reinvestment into fleet modernization and technology enhancements over shareholder returns; share repurchases have been minimal since early last decade while dividends have historically been modest or absent due to earnings variability [F1].
Industry & Regulatory Risks
The trucking sector remains fragmented with intense competition from large carriers possessing greater scale advantages as well as logistic intermediaries adding pricing pressure [S13][S14]. Consolidation trends further concentrate market power among leading players.
Regulatory compliance demands related to safety standards, emissions controls, hours-of-service rules impose ongoing cost burdens that could pressure margins if inadequately managed [S15][S18]. Rising insurance claims costs driven by "nuclear verdicts" elevate liability expenses which Marten mitigates through self-insurance layered with coverage programs [S15][S19].
Customer concentration presents material risk given that the ten largest customers accounted for half of revenue excluding fuel surcharges in 2025; loss or downsizing could materially impact results [S16].
Conclusion
Marten Transport reflects a strategic evolution toward multi-segment integrated transportation focused on high-service niches demanding temperature control while facing margin compression amid macroeconomic headwinds and structural competitive pressures.
Operational excellence enabled by technology investments provides differentiation alongside entrenched customer relationships vital for sustaining revenues during economic uncertainty.
Monitoring contract renewals among key customers combined with effective cost management will be key determinants shaping Marten’s trajectory beyond its transition marked by Intermodal divestiture.
This analysis synthesizes available filings and public disclosures as of February 27, 2026 without providing investment recommendations or price forecasts.
Disclaimer: This is research-only, informational analysis and not investment advice. It may include AI-generated interpretation and general industry context. Always verify important details using primary sources.
Comments