
MACOM Technology Solutions: Data Center Momentum, Strategic Moats, and the Dynamics of Specialized Semiconductor Supply
Surging Data Center demand and margin expansion have put MACOM at the forefront of high-performance RF and optical semiconductors, but sustaining growth will depend on competitive resilience, supply chain agility, and the evolving landscape of defense and telecom markets.
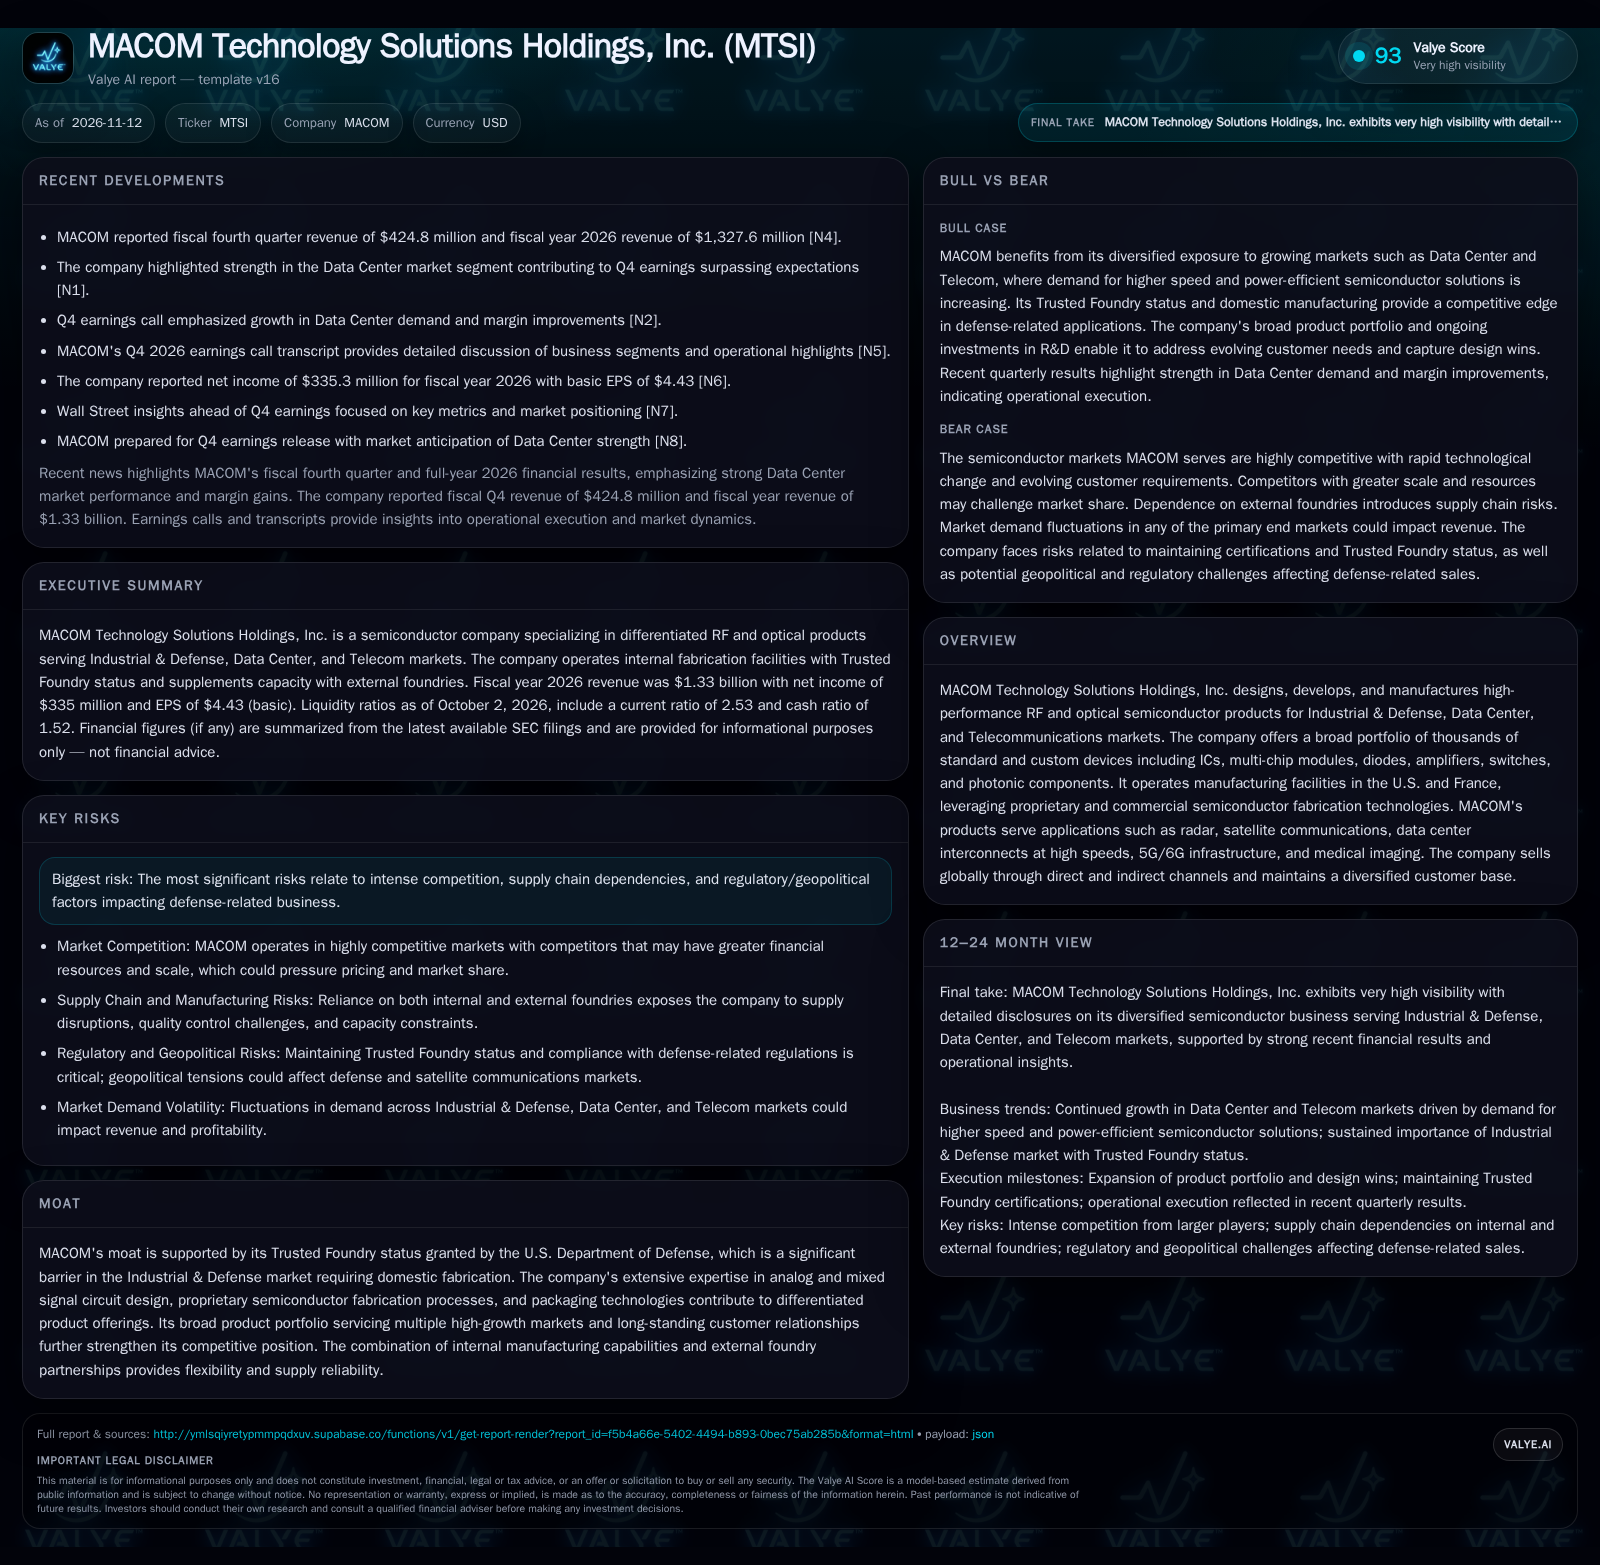
Recent earnings from MACOM Technology Solutions show robust Data Center-driven revenue and margin gains, with fiscal Q4 2026 revenue at $424.8 million and annual revenue reaching $1.33 billion. The company leverages its Trusted Foundry status and hybrid manufacturing model to secure defense contracts and supply reliability. While its broad portfolio and customer base provide diversification, the company faces intense competition and supply chain risks. The next phase of value creation likely hinges on expanding design wins, maintaining certifications, and navigating technological and geopolitical shifts.[N1] [N2] [N4]
MACOM Technology Solutions Holdings, Inc. sits at a crucial intersection of fast-evolving markets for RF and optical semiconductors, with recent quarters showcasing both top-line growth and margin expansion driven by Data Center demand. The company’s blend of proprietary technology, domestic manufacturing with Trusted Foundry status, and a broad, diversified product set positions it as a key supplier to defense, telecom, and hyperscale data center customers. However, the path forward is shaped by the pace of technological change, supply chain complexity, and the pressures of global competition—all of which could either reinforce or erode MACOM’s competitive advantages.
Recent Performance: Q4 Outperformance and Strategic Positioning
MACOM reported fiscal Q4 2026 revenue of $424.8 million and fiscal year revenue of $1,327.6 million, with quarterly earnings surpassing expectations due primarily to strength in the Data Center segment. Management highlighted not only robust demand but also margin gains, suggesting operational leverage and favorable product mix in the latest period. As of October 2, 2026, the company reported a current ratio of 2.53, a cash ratio of 1.52, and combined cash and short-term investments of $792.4 million. The company reported cash and liquidity metrics for the period; these figures do not by themselves establish operating runway, investment capacity, financial flexibility, or financing capacity. The Q4 results, especially the Data Center surge, suggest the company is capturing share or riding a secular wave in high-speed connectivity. [N1] [N2] [N4] [S2]
How MACOM's Business Model Harnesses Volume, Mix, and Technology Leverage
MACOM generates revenue by designing and selling a wide array of RF and optical semiconductor products, spanning integrated circuits, modules, amplifiers, photonic components, and more. The company’s economics are shaped by a combination of high fixed costs—stemming from R&D and capital-intensive internal fabs—and variable costs tied to external foundry use and materials. Gross margins are sensitive to product mix: proprietary, high-performance solutions for defense and emerging data center optical applications typically command higher margins than commoditized telecom components.
Operating leverage is evident when incremental revenue flows through a largely fixed cost base, as seen in the recent margin gains. However, the need for ongoing technology investment and the cyclical nature of some end markets (notably Telecom) mean that margins can be volatile. The company’s hybrid manufacturing strategy—balancing internal Trusted Foundry capacity with external foundries—enables capital efficiency and supply flexibility but does expose MACOM to potential supply chain disruptions and cost variability, especially during periods of tight industry capacity.
Capital needs are ongoing, with investment required both in proprietary process technology (e.g., GaAs, GaN, InP) and in new product introductions. Success in securing design wins—especially for next-gen optical transceivers and defense subsystems—can drive volume growth and reinforce pricing power. However, the economics of each vertical can differ: defense and bespoke industrial applications may offer long-tail revenue and higher ASPs, while data center and telecom markets can be more price-competitive and subject to rapid product obsolescence.
Defensible Moats and Evolving Threats in the Semiconductor Arena
MACOM’s competitive position in Industrial & Defense is anchored by its Trusted Foundry status with the U.S. Department of Defense and domestic fabrication capabilities. This creates a high barrier to entry for rivals lacking the necessary certifications or secure supply chains, and cements MACOM’s role as a strategic supplier for sensitive applications. Proprietary process expertise and a broad analog/mixed-signal design legacy further differentiate its offerings.
However, the broader semiconductor landscape is highly competitive, with customers sometimes seeking to dual-source or vertically integrate key components. Large-scale analog and RF players, as well as specialized photonics competitors, vie for the same design slots in data center and telecom markets. Some customers also possess internal design resources, potentially reducing external supplier volumes over time.
The company’s diversified product suite and customer base (over 6,000 end customers) offer insulation against single-market downturns but also create complexity in go-to-market execution and support. The risk is that as technology cycles accelerate—especially in data center and telecom—MACOM must continuously innovate to avoid margin erosion and displacement by larger or more nimble rivals.
Capturing the Next Wave: If Design Wins and Data Center Demand Accelerate
A favorable scenario for MACOM would see sustained or accelerating demand in data center connectivity (especially 800G/1.6T/3.2T optical interconnects), coupled with new design wins in both defense and telecom infrastructure. If the company leverages its R&D investments to launch differentiated products that become preferred solutions for hyperscale data centers and next-gen radar or communications systems, it could see above-market revenue growth and further margin expansion.
Evidence that would confirm this scenario includes continued quarterly outperformance led by Data Center segment, a growing pipeline of design wins (if disclosed), and positive commentary on new customer engagements in earnings calls. Additional signals would be successful introduction of new optical or RF platforms, increased share of wallet with top customers, and minimal supply chain disruptions in periods of high demand. Margin expansion would likely persist if product mix continues to shift toward proprietary and high-value solutions.
Sustained Diversification with Market Cyclicality and Execution Hurdles
The most plausible path for MACOM is continued moderate growth anchored by strength in Data Center and a steady cadence of defense and telecom orders. The company’s broad product set and customer diversification should provide some insulation against end-market volatility, but cyclical swings—especially in telecom and industrial verticals—will likely create revenue and margin fluctuations.
In this scenario, MACOM maintains its Trusted Foundry status and leverages internal and external manufacturing to meet demand, but competitive price pressure and occasional supply chain constraints cap margin upside. R&D spending remains elevated, supporting incremental product refreshes but not always yielding breakthrough wins. Evidence would include stable or slightly growing quarterly revenues, gross margins that fluctuate with mix but do not break out to new highs, and continued references to both competitive intensity and ongoing investment needs in management commentary.
Margin Compression and Share Loss if Supply, Certification, or Technology Falters
An adverse scenario unfolds if MACOM faces either a sharp pullback in one or more end markets (e.g., a downturn in data center capex or defense budget delays), or if supply chain disruptions (from external foundry partners or internal fab issues) impair delivery and erode customer trust. Additionally, failure to maintain Trusted Foundry certification could quickly disqualify the company from critical defense contracts, while delays in new product introductions could allow competitors to win key sockets.
Evidence supporting this scenario would be sequential revenue declines, shrinking gross margins due to unfavorable product mix or excess costs, and negative management commentary about lost design wins or major customer attrition. Other signals might include increased inventory write-offs, rising R&D as a percentage of sales without corresponding new product traction, or public disclosures of supply or compliance issues. If these factors converge, MACOM could see a material erosion of both market share and profitability.
Testing the MACOM Thesis: Milestones and Metrics to Scrutinize
Quarterly revenue and gross margin trends by segment, especially the trajectory of Data Center versus Telecom and Industrial & Defense. Continued outperformance or reversal in Data Center metrics would be highly informative. [N1] [N2]
Disclosure of design win pipeline, new customer engagements, or backlog expansion (if disclosed), as these signal future share capture and product relevance.
Status updates on Trusted Foundry certification and compliance—any loss or challenge here would be a red flag for defense revenue continuity.
Capital expenditure and R&D spend as a percentage of revenue, which indicates ongoing commitment to technology leadership and innovation.
Supply chain commentary, particularly regarding external foundry capacity and internal fab utilization or disruptions.
Product launch cadence and adoption rates for new platforms in high-speed optical and RF categories—would help test the company’s innovation engine.
Customer concentration risk and any signs of major customer attrition or insourcing, which could signal competitive shifts.
Geopolitical and regulatory developments impacting defense or telecom end markets—changes here could alter addressable market size or revenue visibility.
Disclaimer: This is research-only, informational analysis and not investment advice. It may include AI-generated interpretation and general industry context. Always verify important details using primary sources.

Comments