
Blue Owl Capital's Portfolio and Dividend Dynamics Signal New Risk-Return Balance
Q2 results show Blue Owl moderating leverage expansion amid income yield pressures and credit quality vigilance affecting dividend sustainability.
Blue Owl Capital Corporation’s latest quarterly filings reveal the firm navigating a complex environment marked by compressed investment income yields and cautious portfolio adjustments. The company reports stable but constrained net asset value per share, with credit quality metrics prompting close monitoring of non-performing assets. Dividend payout ratios reflect these constraints, as Blue Owl balances yield attraction against earnings coverage concerns. Capital deployment strategies emphasize selective leverage moderation under regulatory guardrails, situating Blue Owl’s middle-market focused BDC model distinctly within its peer landscape.
Q2 Earnings Reveal Investment Income Yield Pressure Amid Portfolio Shifts
Blue Owl Capital Corporation's second quarter 2026 results highlight significant pressure on investment income yields primarily driven by prevailing interest rate normalization after previous monetary easing periods. According to the August 5, 2026 10-Q filing, the company's revenues—generated chiefly from interest on debt securities and dividends on equity holdings—faced compression as portfolio yield faced headwinds in the current macroeconomic environment [S2]. This compression is substantial because net investment income forms the backbone of revenue for a BDC like Blue Owl; lower yields challenge both income generation and dividend coverage.
Portfolio composition data shows a strategic tilt toward debt securities over equity investments in middle-market companies. This rebalancing underscores management's intent to prioritize predictable cash flows over the more volatile capital gains potential from equity stakes. Given that debt investments typically offer more stable interest streams but lower upside than equities, this shift reflects a conservative posture aiming for steady income despite the yield squeeze [S2]. This change in investment mix directly affects revenue mechanics as debt interest accrual is generally more stable but sensitive to prevailing rates.
Credit Quality Trends Signal Heightened Focus on Non-Performing Assets Management
The quarter also revealed indications of elevated credit risk evidenced by a modest increase in non-accrual loans ratio, marking a watchpoint on portfolio asset quality. Maintaining prudent underwriting standards remains central to Blue Owl’s risk management framework; however, slightly higher non-performing assets suggest pressure points amidst economic uncertainty affecting middle-market borrowers [S2]
Increased non-accrual rates typically lead to higher loan loss reserves and can depress net asset value (NAV) per share through fair value accounting adjustments. Blue Owl’s NAV stability is an essential metric for shareholders as it embodies intrinsic value and influences dividend sustainability perceptions. Management commentary points to intensified oversight and provisioning measures aimed at mitigating risk case in the loan book [S3]. This approach aligns with sector norms where credit quality fluctuations materially impact earnings volatility and investor confidence.
Dividend Policy Adjustments Reflect Earnings Coverage Constraints and Investor Preference Balancing
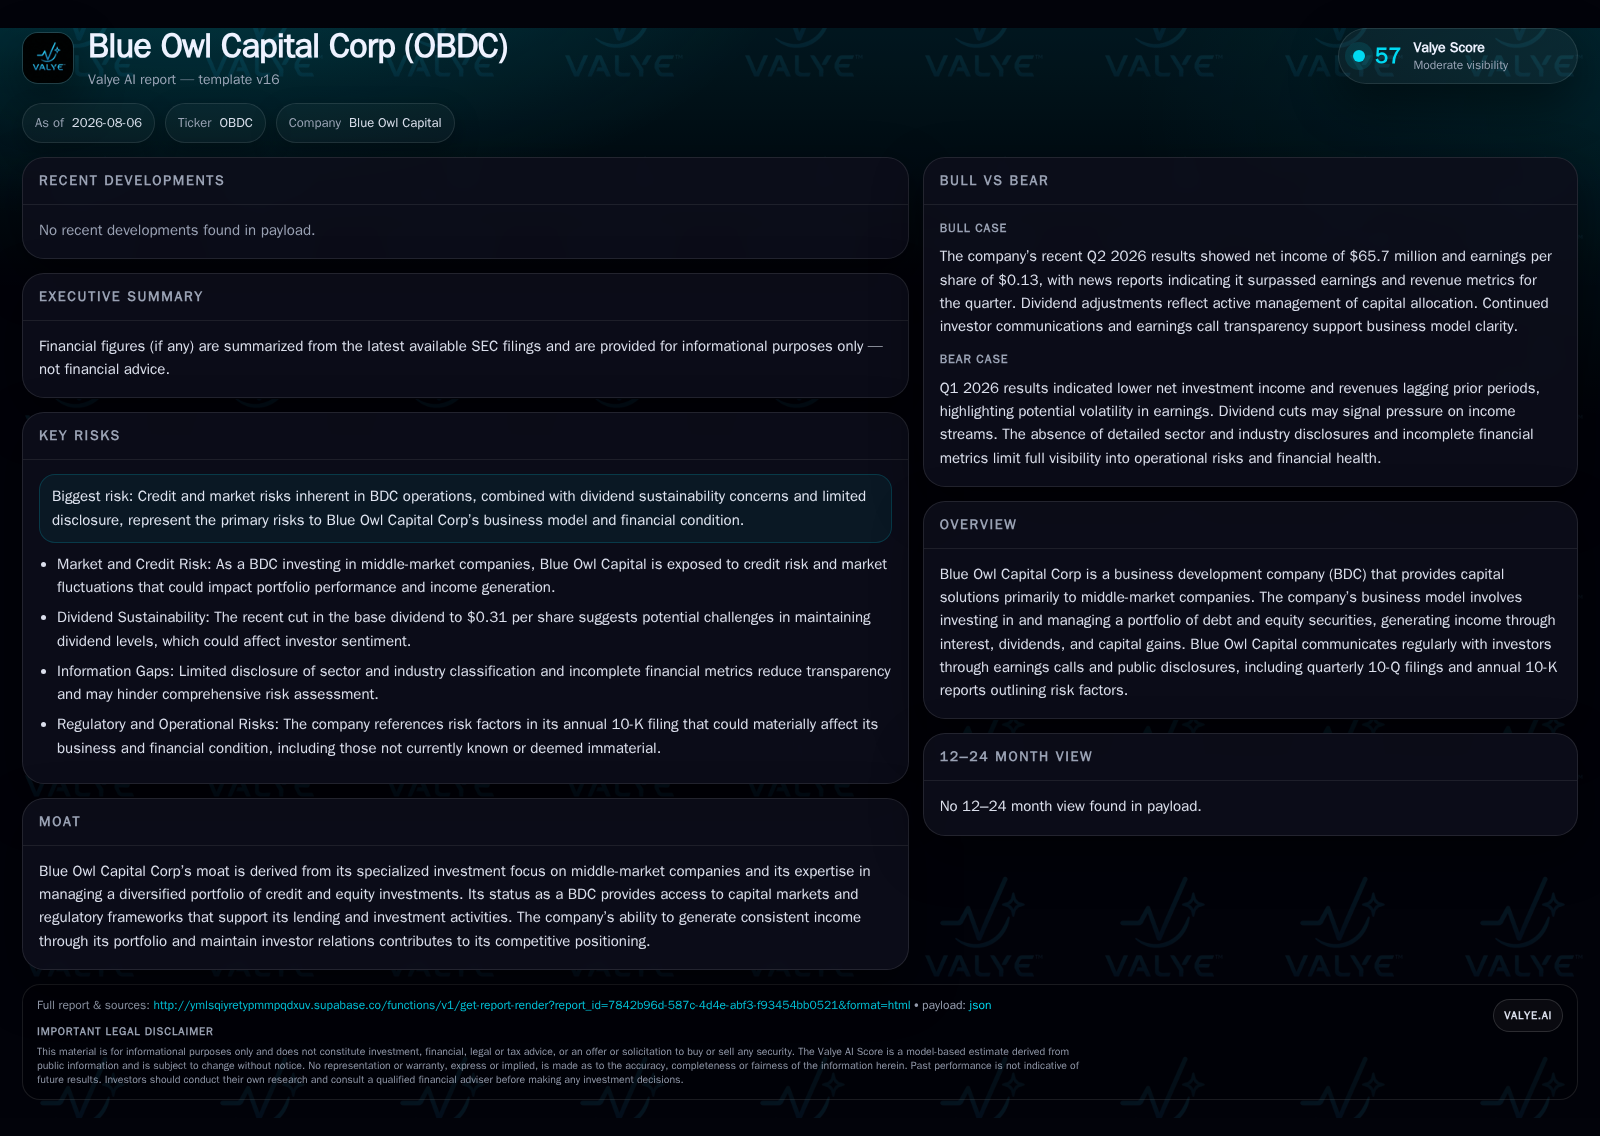
Consistent with compressed yields and credit vigilance, Blue Owl has recalibrated its dividend policy to balance yield attractiveness with sustainable payout coverage. Recent market commentary notes that the base dividend already experienced a reduction to $0.31 per share earlier in 2026 reflecting these dynamics [N3]. The quarterly filing confirms these adjustments are deliberate responses to preserve capital flexibility amidst uncertain income prospects [S2].
A measured approach to leverage supports balance-sheet resilience—a prerequisite for absorbing credit shocks and sustaining dividends during challenging cycles. Compared with peers such as FS KKR Capital Corp (FSK), which exhibits a more credit-centric model focused intensively on syndicated loans and distressed situations, Blue Owl balances moderate risk exposures with diversification.
Comparisons with Golub Capital BDC (GBDC) indicate that while Golub leans heavily on floating-rate senior secured lending yielding higher portfolio yields under benign market conditions, Blue Owl’s mixed portfolio strategy tempers potential volatility at scale costs. Ares Capital Corporation (ARCC) serves as an industry benchmark for size, leverage optimization, and dividend stability; Blue Owl's smaller scale relative to ARCC translates into potentially less pricing power but greater flexibility within its operating segment.
Growth Opportunities Rooted in Private Credit Market Expansion Confront Rate Environment Challenges
Demand drivers for Blue Owl stem from sustained needs within middle-market companies for alternative financing solutions beyond traditional bank credit lines—a structural trend amplified by banking regulatory tightening post-financial crises. Expanding private credit markets provide fertile ground for capital deployment as middle-market firms seek flexible debt products coupled with equity participation options.
However, growth is moderated by macroeconomic factors including interest rate volatility limiting deal volume expansion and elevating borrowing costs for end-users. Regulatory developments favoring BDC transparency and governance bolster long-term industry viability but require continuous adaptation by firms like Blue Owl. Innovation in structuring bespoke financing packages also presents pathways to deepen client relationships enhancing recurring revenues.
Risks Persist in Credit Cycle Exposure, Dividend Sustainability, and Regulatory Compliance Vigilance
Principal risks articulated in filings include heightened credit risk from borrower defaults or downgrades amid economic uncertainties impacting middle-market segments disproportionately [S16]. Market valuation risks affect portfolio fair values influencing NAV per share variability. Interest rate risk remains salient as cost of capital shifts influence both investment returns and borrowing expenses.
Liquidity strains stemming from redemptions or capital call timing mismatches represent operational risks. Compliance obligations impose additional governance burdens; failure could precipitate regulatory penalties or impair market access. Dividend payout pressures persist given balancing acts between shareholder return demands versus capital retention needs to absorb losses or fund growth initiatives.
"Watchlist" Items: Key Milestones for Credit Resets, Earnings Guidance Updates, and Leverage Metrics
Investors should monitor upcoming quarterly disclosures for updates on non-accrual balances trends indicating credit stress trajectories. Clearer signals on dividend policy adjustments reflecting evolving earnings coverage will inform sustainability perspectives. Leverage ratio trajectories against covenants will provide insights into management's appetite for opportunistic growth versus conservatism.
Capital deployment rates amid persisting macro uncertainty will be critical metrics signaling firm confidence in originations pipelines. Additionally, issuance activity around new notes or refinancing terms will illuminate cost of capital environment impacts objectively affecting returns potential.
Financial Profile Discussion
Net investment income trends confirm ongoing pressures on yield compression partly offset by disciplined expense management; however, earnings coverage ratios implicitly signal tighter margins constraining dividend flexibility particularly compared to more mature large-cap BDC peers such as ARCC. Ongoing focus on non-performing assets provisioning further influences reported profitability metrics.
Overall liquidity metrics appear adequate relative to current operational commitments though continuous monitoring is warranted in light of evolving market volatility factors impacting investor demand in public equity channels affecting raising new capital efficiently.
This analysis synthesizes publicly available filings including the August 5th Q2 2026 Form 10-Q and concurrent 8-K disclosures alongside corroborating market commentary without providing investment advice or research views.
Disclaimer: This is research-only, informational analysis and not investment advice. It may include AI-generated interpretation and general industry context. Always verify important details using primary sources.

Comments