
O-I Glass: Cost Discipline Counters Demand Pressures as Energy Volatility Tests Model
O-I Glass’s 2025 results reveal a company in transition—segment profits climb on aggressive cost controls, but top-line and net income remain pressured by weak volumes, pricing, and persistent energy risks. The core question is whether operational streamlining and premium product strategies can counteract structural challenges in glass packaging economics.
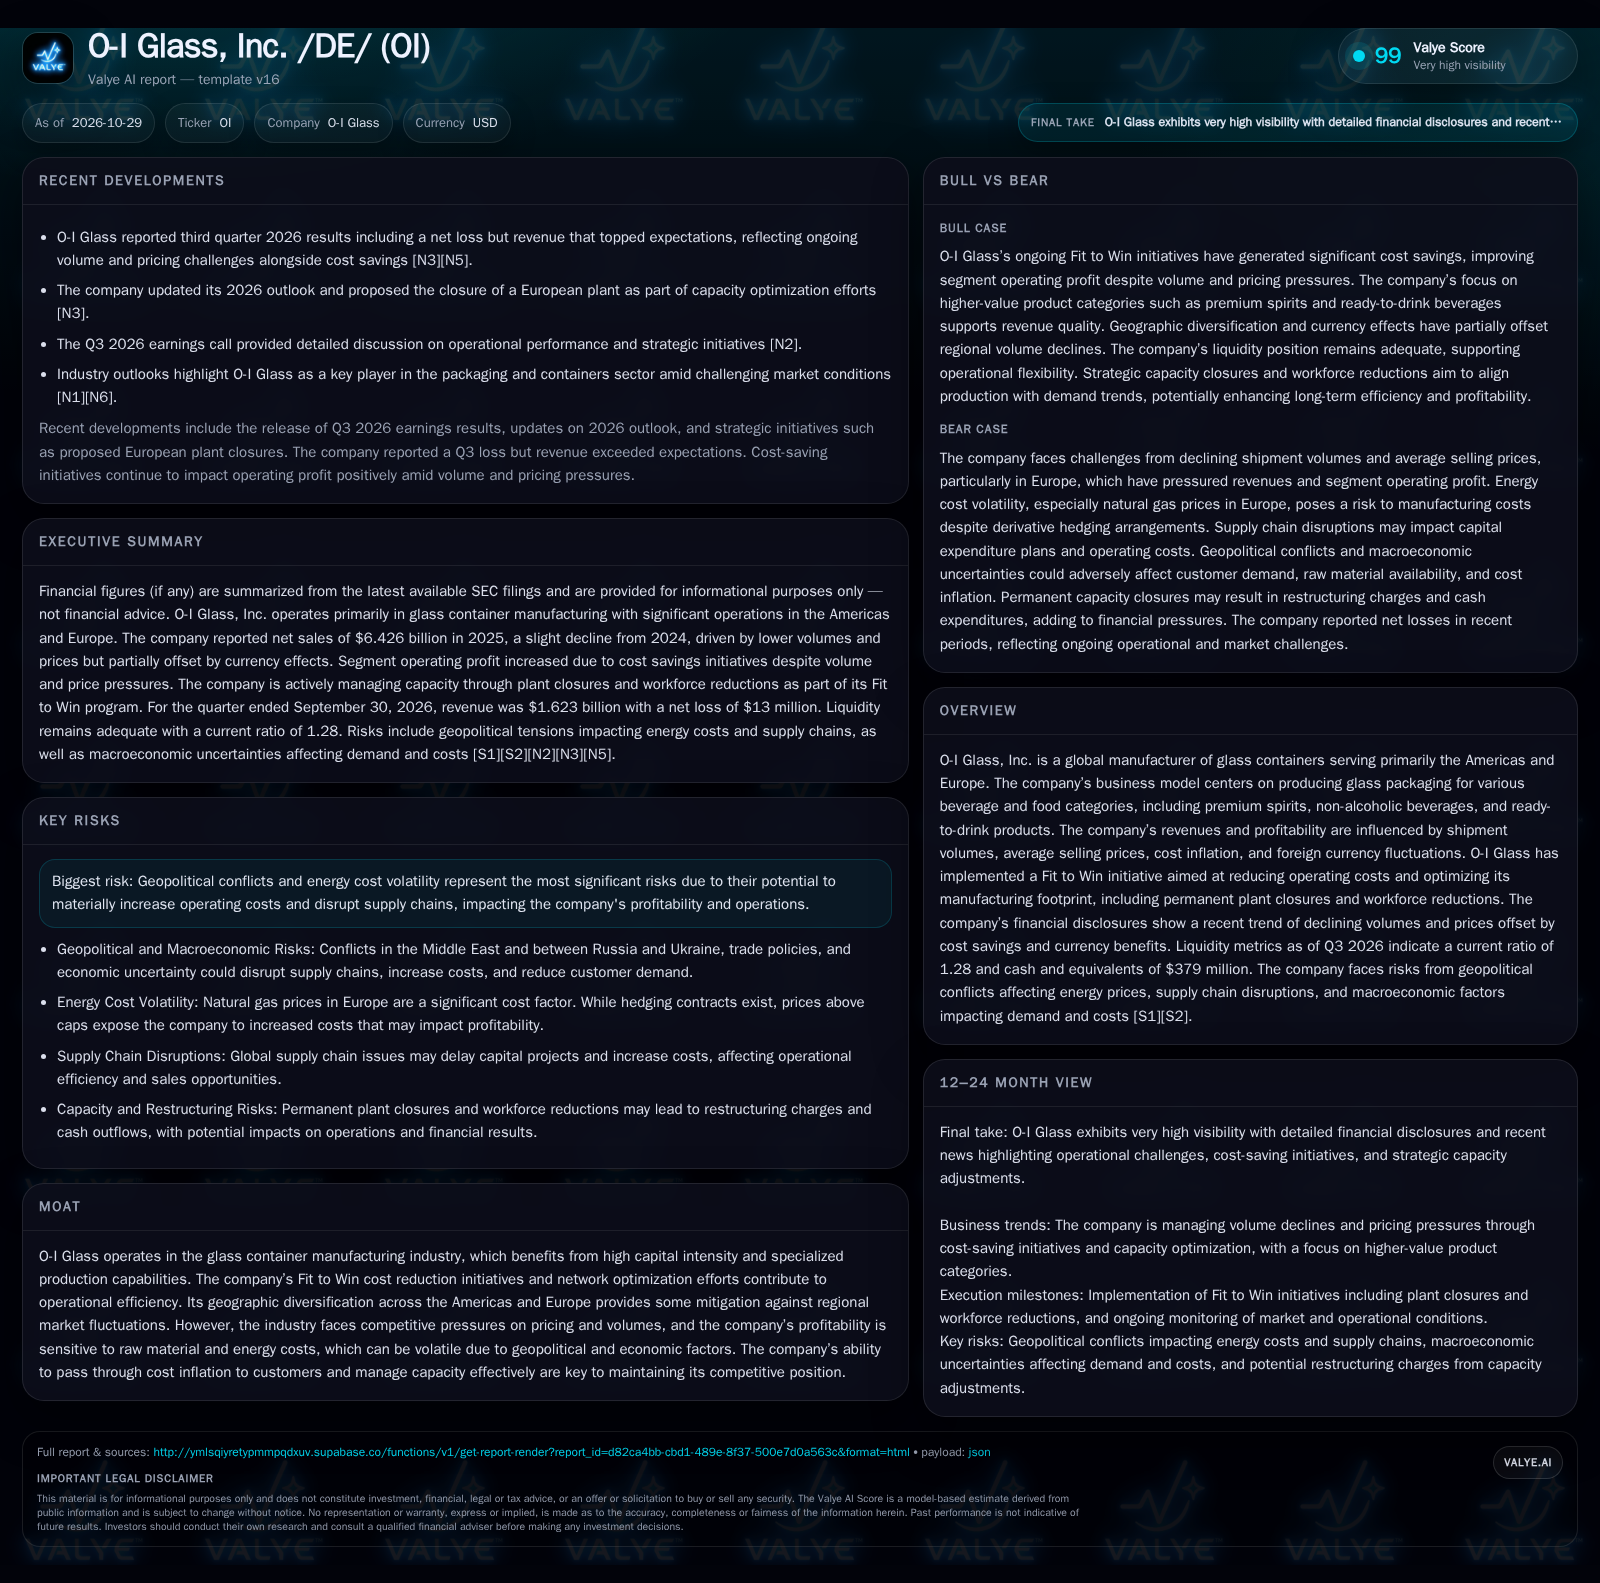
O-I Glass saw 2025 segment profits rise 13% despite a 2% revenue decline, as Fit to Win cost initiatives and capacity reductions offset lower volumes and prices. The Americas outperformed Europe, but ongoing energy cost risks, plant closures, and exposure to macro volatility keep the outlook uncertain. The company’s ability to align production with demand and manage energy headwinds will determine future profitability [S1] [S2] [N3] [N5].
O-I Glass, a global glass container manufacturer, is navigating a complex cycle of declining shipment volumes and price pressures, particularly acute in its European segment. Despite these top-line headwinds, the company delivered a substantial 13% increase in segment operating profit for 2025, attributing gains to its aggressive Fit to Win cost-saving program and capacity rationalization—including plant closures and workforce reductions. However, net losses continue, and the business remains exposed to volatile energy costs, especially natural gas in Europe, as well as ongoing supply chain and macroeconomic uncertainties. The next phase for O-I Glass hinges on whether its operational restructuring and focus on premium product lines can sustainably offset structural demand and cost challenges [S1] [S2] [N3] [N5].
Cost Rationalization Drives Profit Gains Amid Weak Demand
O-I Glass reported 2025 net sales of $6.426 billion—a 2% year-over-year decline—driven by lower shipment volumes and average selling prices. The Americas segment bucked the trend, with sales rising 2% as higher prices offset a 2% decline in volume. Conversely, Europe saw a 5% revenue drop on both lower prices and a 3% fall in shipments, despite some currency tailwinds. Segment operating profit increased 13% to $846 million, primarily due to cost reductions from the Fit to Win initiative, which included permanent closures of several plants and workforce reductions in both regions. Despite these operational gains, the company posted a net loss of $129 million for 2025, reflecting non-recurring charges and persistent market headwinds. The company also announced a proposed European plant closure in Q3 2026 as it continues to optimize capacity in response to demand trends [S1] [S2] [N3].
Glass Container Economics: Fixed Costs, Pricing Power, and Margins in Flux
O-I Glass’s business model is characterized by high fixed costs—mainly from capital-intensive furnaces, plants, and a skilled workforce—paired with variable costs heavily influenced by energy (especially natural gas in Europe), raw materials, and logistics. Revenue is driven by shipment volumes and average selling prices, with product mix (premium vs. commodity) affecting margins. The company’s ability to pass through input cost inflation to customers is crucial, but recent results show pricing power is uneven, as price increases in the Americas offset volume declines, while Europe saw both price and volume erosion.
Operating leverage is significant: when volumes fall, fixed costs are spread over fewer units, compressing margins unless offset by cost cuts or price hikes. The Fit to Win program aims to structurally lower the cost base, but plant closures and workforce reductions also limit the company’s ability to quickly scale up if demand rebounds. Capital needs remain substantial for furnace maintenance, plant modernization, and environmental compliance—delays or cost overruns due to supply chain issues could further pressure margins. The net loss for 2025 also highlights that cost reductions alone have not fully counteracted revenue pressures or non-recurring charges [S1] [S2].
Market Structure: Capital Barriers, Substitution Threats, and Regional Divergence
O-I Glass competes in a traditional industry with high barriers to entry due to capital intensity and specialized production know-how. This confers some protection from new entrants, but the sector faces competition from alternative packaging materials—particularly plastic and aluminum—which offer advantages in weight, flexibility, and sometimes cost for certain beverage and food categories. Shifting consumer and customer preferences, as well as sustainability trends, can reshape the competitive landscape: glass is favored for its recyclability and premium image but penalized for weight and breakability.
Within the glass segment, competition is often regional due to shipping costs and customer proximity requirements. O-I’s geographic diversification across the Americas and Europe provides some insulation against localized downturns, but also exposes the company to divergent market trajectories—evident in the Americas’ relative resilience versus Europe’s sharper declines. Effective capacity management and the ability to target higher-value end markets (e.g., premium spirits, specialty beverages) are increasingly important for defending margins against volume and price pressure.
If Cost Control Combines with Premiumization, Margin Expansion Is Plausible
A favorable scenario emerges if O-I Glass successfully aligns production with demand using its Fit to Win restructuring, while further shifting its portfolio toward premium, higher-margin product categories. If the company can sustain or enhance price discipline—especially in the Americas—and energy costs stabilize or decline (or are effectively hedged), improved operating leverage could drive a sustained rebound in profitability.
Confirmation would come from a return to shipment growth, especially in premium segments, combined with stable or rising average selling prices and further reductions in per-unit operating costs. Sustained positive segment operating profit margins, narrowing net losses, and evidence of successful cost pass-through to customers would strengthen the bullish case. Conversely, if premiumization fails to offset commodity glass declines, or if energy volatility overwhelms cost cuts, the upside would be constrained.
Managing for Efficiency While Navigating Structural Headwinds
The most plausible outlook is a company that continues to aggressively manage costs and optimize capacity, but faces persistent volume and pricing pressure, especially in Europe. Operating profit may remain stable or improve modestly as further Fit to Win savings are realized, but net income could remain under pressure due to restructuring costs, macroeconomic weakness, and energy volatility.
Evidence supporting this scenario would include flat or slightly declining shipment volumes, modest changes in average selling prices, ongoing plant/furnace closures or workforce reductions, and continued use of energy hedges with some residual exposure to price spikes. Margins may stabilize but not expand meaningfully unless demand recovers or input costs ease. If volumes continue to decline or energy costs surge, the company could see further net losses despite operational improvements.
Energy Shocks and Demand Weakness Could Outpace Cost Savings
A negative scenario would see further deterioration in European demand coupled with renewed energy cost spikes—especially if geopolitical conflicts escalate or supply constraints persist. If O-I Glass is unable to offset input inflation through pricing or further cost reductions, segment margins could compress sharply, and net losses could widen.
This scenario would be confirmed by another leg down in shipment volumes, significant declines in average selling prices, unplanned plant shutdowns, or delays in capital projects due to supply chain disruptions. If energy derivatives fail to cap costs or if restructuring charges climb, liquidity could tighten and the company might be forced into more drastic asset sales or capital raises to maintain operations.
What Will Determine If O-I Glass’s Transformation Holds—Or Falters
Quarterly shipment volumes by region and product category—if disclosed—to track whether volume declines are stabilizing or accelerating.
Average selling price trends in the Americas versus Europe, as an indicator of pricing power and mix improvement.
Segment operating profit margins and their drivers (cost savings vs. price/mix), which would show whether Fit to Win gains are sustainable.
Actual realized energy costs and the effectiveness of derivative hedges, especially in European operations.
Progress on planned and proposed plant/furnace closures, including associated restructuring charges and projected cost savings.
Capital expenditure execution versus plan—delays or overruns would signal supply chain or operational stress.
Updates on customer mix and product portfolio, highlighting the share of premium or specialty glass versus commodity categories.
Evidence of renewed net income/profitability or further net losses, particularly in the context of one-time versus recurring charges.
Disclaimer: This is research-only, informational analysis and not investment advice. It may include AI-generated interpretation and general industry context. Always verify important details using primary sources.

Comments