
How Ovintiv’s Portfolio Moves and Hedging Strategies Shape its Operational Resilience
Ovintiv's Q2 2026 results illustrate the financial impact of its multi-basin portfolio strategy and commodity risk management amid capital intensity pressures.
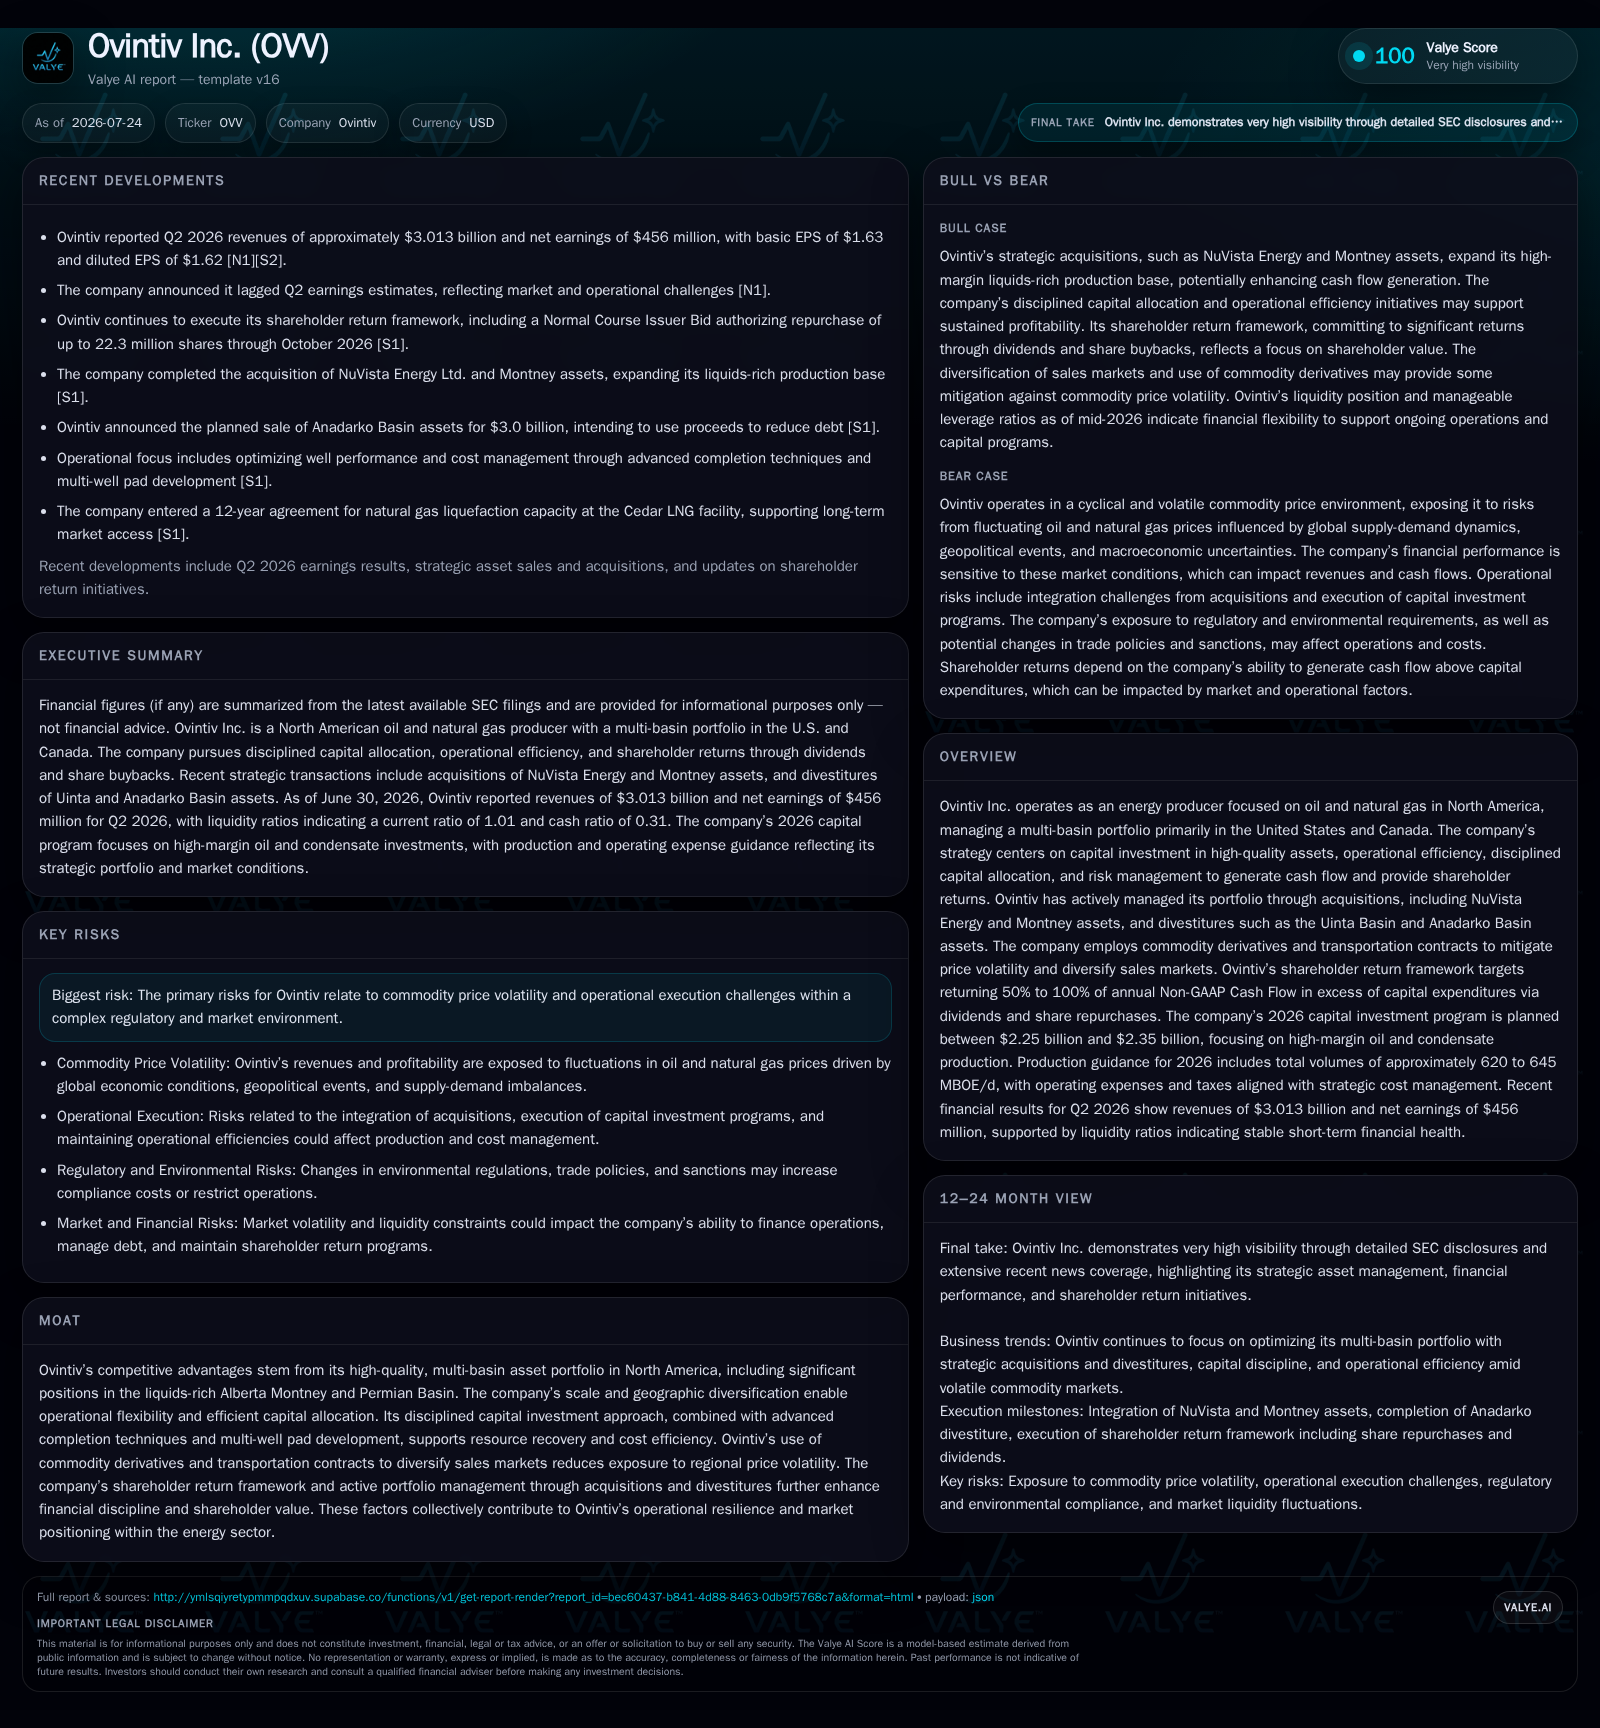
In Q2 2026, Ovintiv Inc. experienced revenue growth driven by increased production volumes and favorable commodity prices; however, higher operating expenses and capital expenditures compressed margins and strained cash flow. The company’s diversified North American asset base, especially liquids-rich Montney and Permian assets, supports scale but reveals mixed cost performance across basins. Ovintiv's commodity derivatives hedge a portion of price risk, mitigating volatility effects on earnings despite operational execution variability. Recent acquisitions and divestitures refine the portfolio but raise questions about optimizing asset mix to sustain disciplined capital allocation. Going forward, shareholder returns hinge on balancing capital spending with free cash flow amid ongoing commodity price uncertainty and regulatory challenges.
Q2 Operational Update Reveals Margin Pressures Amid Capital Intensity Increase
Ovintiv’s Q2 2026 financial results show a mixed picture where revenue growth to $3.0 billion was buoyed by improved production volumes coupled with stronger commodity pricing compared to prior periods [S2]. Yet despite top-line gains, net income lagged analyst expectations due in part to escalating operating expenses—particularly transportation and processing costs that rose from $435 million in Q2 2025 to $540 million—and sustained high capital expenditures continuing near $600 million for the quarter [S2],[N1]. This reflects an industry-wide challenge where operators face rising input costs alongside spending intended to sustain or grow hydrocarbon output. While gains on risk management added $122 million net in the quarter cushioning some margin pressure, the overall effect indicates margin compression driven by cost increases outpacing realized price improvements [S2]. These dynamics underscore a tension between maintaining robust upstream activity across multiple plays and achieving disciplined cash flow generation under volatile market conditions.
(Re)Balanced Scale: Liquids-Rich Assets Support Production Volume Gains but Cost Structure Remains Mixed Across Basins
Ovintiv’s asset portfolio is anchored by sizeable positions in the liquids-rich Alberta Montney and key Permian Basin holdings, supported by recent acquisitions such as NuVista Energy's Montney assets which enhance liquids exposure,[S1]. The company employs multi-well pad development to drive resource recovery efficiencies and reduce per-unit completion costs—techniques critical in maintaining competitiveness relative to peer pure-play E&P firms concentrated in North America. However, operational data suggests a heterogeneous cost structure with transportation-related expenses notably above historical levels indicating some basin-specific challenges possibly tied to takeaway capacity constraints or contractual cost escalations [S2]. Transportation contracts partially mitigate such risks by diversifying sales channels beyond localized spot markets but do not fully offset rising opex burdens observed during the quarter. Comparatively, Ovintiv maintains scale advantages allowing some operational flexibility yet must continue refining basin-level cost controls to improve unit economics amid sector cost inflation trends.
Hedging Strategy Softens Commodity Risk but Execution Variability Persists
Commodity price volatility remains a defining risk for oil and gas producers like Ovintiv. The company transparently uses commodity derivatives instruments to hedge a significant portion of anticipated production volumes, thereby stabilizing realized prices against spot market swings—a valuable tool given fluctuating crude and natural gas benchmarks impacting revenues unpredictably [S1],[S2]. In Q2 2026, hedging gains contributed $122 million net, signaling effective downside price protection during periods of price softness while preserving upside participation when prices rise moderately. Coupled with transportation contracts' role in broadening market access outside regional benchmarks with wider differential risk exposure, this approach aligns well with financial discipline objectives. Nevertheless, variability in operational execution—including fluctuating production volumes linked to uneven well completion pacing—introduces some earnings predictability challenges beyond pure commodity risk mitigation.
Portfolio Adjustments Signal Focus Shift but Raise Questions on Asset Optimization
Over recent years Ovintiv has actively rebalanced its asset base via targeted acquisitions such as NuVista Energy's liquids-rich Montney holdings alongside divestitures like Uinta Basin and Anadarko Basin assets,[S1]. This reshaping tilts the resource mix toward higher-margin liquids hydrocarbons consonant with strategic priorities favoring durable cash flow generation from premium quality reserves. However, increased capital intensity associated with developing these newer or more liquids-focused properties introduces execution complexity visible in variable capex absorption rates per basin reported this quarter [S2]. Such reallocation raises questions about how rapidly Ovintiv can optimize returns from acquired assets versus those sold off while sustaining reserve replacement ratios that underpin medium-term production visibility. Maintaining capital discipline amid volatile commodity prices will be critical to ensuring these portfolio moves translate into sustainable margin improvement rather than transient volume growth at disproportionate cost.
Shareholder Returns Depend on Navigating Cash Flow Constraints Efficiently
Ovintiv commits to distributing 50%–100% of Non-GAAP Cash Flow exceeding capital expenditure via dividends and share repurchases as part of its shareholder return framework [S1]. The sustainability of this policy hinges on operational efficiency improvements given rising capex intensity demonstrated in recent quarters. With free cash flow pressured by elevated spending needed to ramp new wells primarily in liquids plays, managing payout ratios without compromising balance-sheet strength constitutes an ongoing challenge. Balanced allocations between reinvestment for growth versus returning cash reflect typical sector trade-offs heightened by recent earnings shortfalls relative to estimates [N1],[S2]. Effective hedging buffers downside revenue risk supporting smoother free cash flow profiles beneficial for dividend coverage but sustained margin expansion through lower unit costs or higher realized pricing will be necessary for reliable long-term payout maintenance.
Growth Drivers: Technological Advances and Market Access Expansion at a Crossroads
Technological progress remains a pivotal growth driver; adoption of advanced drilling and completion techniques such as multi-well pad developments enhances resource extraction efficiency lowering per-BOE costs while supporting reserve life extension within mature basins like the Permian or Montney,[S1]. Likewise, strategic use of transportation contracts facilitates access to diverse sales markets reducing bottlenecks typical in constrained regional infrastructure environments that can depress netbacks due to basis differentials. Moving forward, expansion or optimization of transport capacity alongside continuous innovation in drilling completions is essential to counterbalance increasing operating expense pressures encountered this quarter. These growth levers credibly offer pathways to improving operational leverage if executed timely amidst regulatory environments that can impose additional compliance costs or delay project schedules.
Watchpoints: Commodity Price Volatility, Regulatory Environment, and Capex Execution Risks
Key risks persist around sustained commodity price fluctuations shaping top-line revenue trajectories critical for funding capital programs without escalating leverage unduly [S1],[S2]. Despite hedging mitigating some exposure scope remains significant given large underlying physical production sensitivity inherent in upstream operations. Additionally, execution risks related to meeting planned capex timing targets pose risk case; any delays or inefficiencies impair production ramp-ups affecting near-term cash generation. Regulatory shifts imposing tighter environmental standards could increase compliance complexity or costs impacting operating flexibility especially across U.S. jurisdictions housing major assets. Monitoring these variables closely will be crucial for maintaining investor confidence aligned with disciplined capital allocation promises.
Financial Profile Discussion: Leverage Manageable with Tight Liquidity Parameters
As of June 30, 2026, Ovintiv held approximately $700 million in cash against total debt near $3.7 billion resulting in net debt around $3.0 billion—a leverage level manageable within sector norms given diversified asset quality though sensitive to ongoing capex demands [F1]. Current assets of $2.2 billion and current liabilities of $2.2 billion imply a current ratio near 1.01x reflecting prudent working capital management despite tight liquidity parameters following increased investments needed for growth initiatives [F1].
This analysis synthesizes Ovintiv Inc.’s latest quarterly disclosures combined with broader industry context characteristic of North American upstream oil and natural gas operators managing multi-basin portfolios under volatile commodity conditions. Although committed to capital discipline frameworks augmented by risk management tools like commodity hedges and transport contracts, challenges remain integrating expanded liquids-rich holdings effectively while controlling rising operating expenses across geographically dispersed assets. Improving operational efficiency alongside cautious portfolio optimization will be key determinants shaping future cash generative capacity and shareholder value realization amid cyclically sensitive sector conditions.
The information herein incorporates material from SEC filings dated July 23, 2026 (10-Q) and February 23, 2026 (10-K), supplemented by contemporaneous news reports; it does not constitute investment advice but aims to provide a detailed industry-centric review supported by company-reported data.
Disclaimer: This is research-only, informational analysis and not investment advice. It may include AI-generated interpretation and general industry context. Always verify important details using primary sources.

Comments