
PACCAR’s Resilient Truck Leadership Amid Tariff Pressures and Innovation Investments
PACCAR navigates mixed truck demand with steady parts growth and expanding financial services, underpinned by strategic manufacturing footprint and R&D focus.
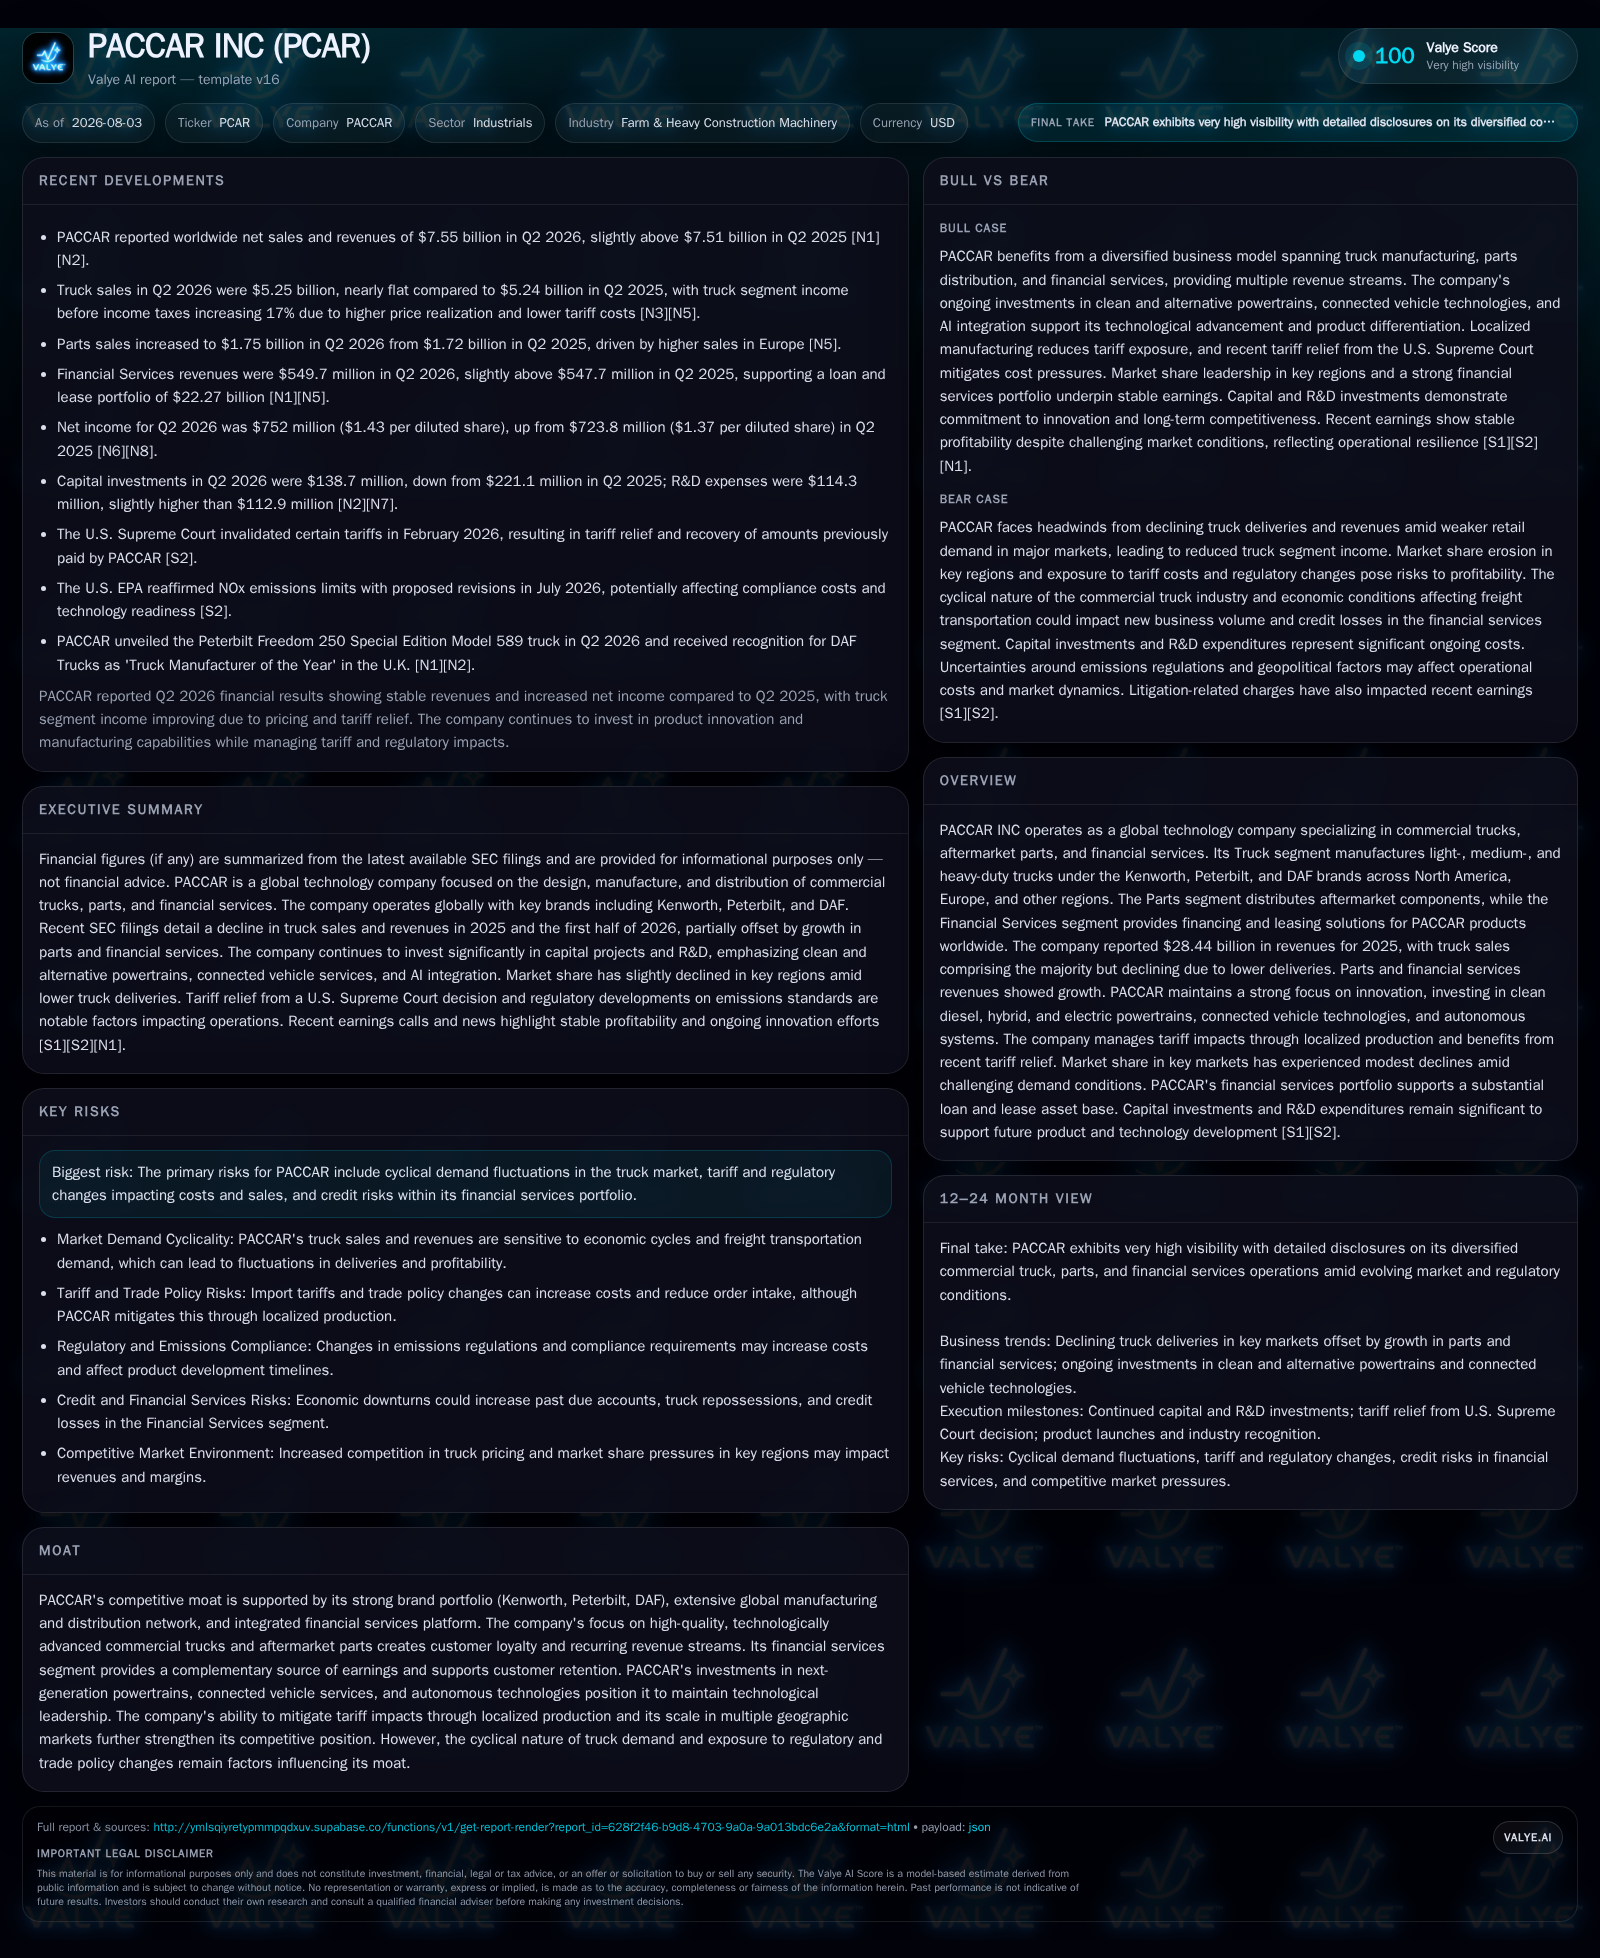
In Q2 2026, PACCAR reported stable revenues despite ongoing headwinds from tariff impacts and cyclical truck demand softness in North America and South America, offset by Europe’s resilience and strong performance in its Parts and Financial Services segments. The company continues to invest heavily in emerging powertrains, connected services, and autonomous vehicle development while maintaining a robust financial services portfolio that supports customer retention. Mitigation of tariff pressures through localized production and a diversified geographic manufacturing presence are key strategic advantages as PACCAR adapts to regulatory and market volatility. Capital spending and R&D remain elevated to sustain long-term competitive differentiation.
Latest Operating Update Highlights
PACCAR’s second quarter of 2026 demonstrated operational resilience during persistent headwinds from input cost inflation and ongoing trade tariffs impacting commercial trucks. Reported worldwide net sales and revenues of $7.55 billion showed a slight increase over $7.51 billion a year prior, reflecting near-stable overall performance despite divergent trends within segments [S2]. Truck sales held steady at $5.25 billion versus $5.24 billion in Q2 2025; however, this masked regional variation with softening deliveries across North America and South America contrasted by marginal gains in Europe [S2]. The Parts segment grew modestly to $1.75 billion from $1.72 billion primarily due to increased European aftermarket demand—a critical source of recurring revenues less sensitive to new truck cycle fluctuations [S2]. Financial Services revenues nudged upward to $549.7 million from $547.7 million as the outstanding loans and leases portfolio maintained strength at $22.27 billion total assets under management [S2].
Cost pressures remain significant with an average cost per truck increase of $27.3 million attributed mainly to rising material costs such as steel and semiconductors, expanded truck content reflecting technological advancements, and labor wage inflation. Yet the company benefited partially from reduced tariff expenses due to mitigations implemented via local production strategies—the North American factories are optimized for compliance with the Section 232 tariffs introduced in late 2025 by manufacturing trucks domestically for the U.S., Canada, and Mexico markets [S1, S2]. This localization strategy is crucial as it cushions PACCAR against the adverse margin impact most competitors face when exposed to import tariffs.
Business Model Overview
PACCAR operates an integrated model comprising three primary segments: Truck manufacturing under venerable brands Kenworth, Peterbilt (North America), DAF (Europe), and Kenworth/DAF outside these regions; Parts distribution supplying aftermarket components critical for vehicle maintenance; and Financial Services offering leasing and financing solutions globally [S1].
The Truck segment generates revenue through unit deliveries driven by fleet operators' replacement cycles, infrastructure demand for freight capacity expansion, regulatory shifts favoring cleaner vehicles requiring new technology adoption, and regional economic trends influencing freight volumes. Pricing mechanics hinge on product mix including advanced powertrains (diesel hybrids, battery-electric), cab innovations, durability features for vocational applications like mining (Kenworth C580) or construction (DAF electric rigs) which support premium pricing [S19]. Margins here depend heavily on raw material input costs, supply chain efficiency, manufacturing scale utilization rates, tariff exposures, and dealer network reach.
The Parts segment benefits from a large installed base of vehicles requiring scheduled maintenance or unplanned repairs; it enjoys relatively stable volumes even in downturns as fleet operators extend equipment lifecycles before replacement [S1]. Recurring parts sales underpin cash flow consistency given that components often carry high gross margins.
Financial Services complements truck sales by providing attractive leasing rates tailored to customer credit quality assessed via rigorous underwriting standards across North America, Europe, Australia, Latin America [S1,S2]. This segment recycles capital through medium-term notes issuances while managing credit risk through diversification across geographies and client industries (hauling/logistics firms). Growing revenue here depends on portfolio expansion driven by new truck sales volume while maintaining low credit loss rates amid macroeconomic challenges.
Industry Structure & Competitive Position
PACCAR competes in the global heavy-duty commercial vehicle sector alongside Volvo Group, Daimler Trucks/Mercedes-Benz Trucks (now separately publicly traded), Navistar International (TRATON group), and others focused on premium product quality combined with comprehensive service ecosystems including financing.
The industry is capital intensive requiring continuous investment in manufacturing footprint expansion or modernization—PACCAR has demonstrated this with recent robotic paint facilities in Ohio and engine plant upgrades both domestically and abroad enhancing production flexibility and cost control amid shifting trade policies [S1,S14,S24]
Technological innovation is central to differentiation: next-generation clean diesel engines compliant with increasingly stringent EPA standards maintain relevance pending full electrification adoption; expansion into battery-electric trucks especially with vocational electric chassis models bolsters future-ready positioning; connected vehicle platforms enable uptime monitoring optimizing fleet management efficiency; autonomous system development targets operational safety gains—areas where peers are similarly investing but differing execution timelines will be material going forward [S8,S13,S19].
PACCAR’s integrated financial services arm also provides competitive stickiness uncommon among pure manufacturers: supporting customers’ acquisition costs encourages brand loyalty while capturing finance yield whereas independents without such platforms typically cede repeat business opportunities post-sale.
Growth Drivers
Structural factors underpinning PACCAR’s growth include accelerating freight e-commerce volumes necessitating expanded trucking fleets globally; increasing replacement cycles as aging fleets retire or regulation mandates newer compliant models; aftermarket parts growth fueled by larger fleet numbers combined with higher utilization intensity; financial services portfolio growth tied closely to unit sales plus extended product offerings like operating leases enhancing accessibility. Clean technology transitions form a further growth vector as fleets adopt hybrid/electric powertrains incentivized by regulation or operating cost savings mandates infrastructure investments supporting heavier load transport generate consistent demand for specialized vocational trucks. Geographic diversification beyond North America into Europe (via DAF) where diesel remains dominant longer smooths cyclical demand unevenness; emerging market expansions underpin longer-horizon volume ramp opportunities. Capital spending plans exceeding $700 million annually focused on flexible manufacturing capability improvements signal readiness for scaling new product lines without compromising quality metrics critical for premium pricing.
Risks & Watchpoints
The cyclical nature of commercial truck demand remains a core challenge: macroeconomic slowdowns or freight volume contractions can swiftly depress unit orders causing underutilization across fixed-capacity plants potentially pressuring margins. Trade policy volatility remains a permanent uncertainties driver—ongoing global tariff regimes create cost unpredictability particularly on imported components though PACCAR’s local production offsets some risks. Regulatory changes pose compliance cost escalations especially around emissions standards (e.g., NOx limits reaffirmed by EPA) that may impose warranty extensions or technology development burdens altering profitability dynamics. Credit risk exposure within Financial Services must be monitored vigilantly during economic downturns when default rates could spike increasing reserve requirements or write-offs impacting earnings stability. Supply chain disruptions—semi-conductor shortages or raw material inflation—can delay deliveries inflating working capital needs further pressuring operating leverage. Competitive pricing pressure from other OEMs investing aggressively in electric/autonomous technologies may erode traditional margin pools should PACCAR lag technologically or commercially. Currency fluctuations affect results given global sourcing/sales footprint impacting translation adjustments though hedging tools mitigate. Litigation costs related to historical civil claims (such as recent European charges) introduce non-recurring expense volatility affecting adjusted profitability comparability.
What To Watch Next
Key indicators include order backlog analysis across regions highlighting demand sustainability; units delivered segmented by model types evaluating shift towards alternative powertrains; aftermarket parts revenue growth rates indicating fleet size resilience;
financial services portfolio asset growth coupled with credit loss trends offering insight into end-customer health; cost per truck trends dissecting inflation impact versus tariff relief effectiveness; milestones on new product launches or facility capacity ramp-ups signaling investment returns; and regulatory announcements either tightening emissions compliance or altering trade frameworks will likely influence sales/margin trajectories materially. Earnings guidance refinements during upcoming quarters will help clarify management’s view of macro recovery timing given uncertain freight market fundamentals globally.
Financial Profile Discussion
PACCAR maintains a strong balance sheet with committed bank credit facilities aggregating $4.00 billion, all unused as of June 30, 2026, providing ample backup liquidity primarily for commercial paper borrowings and maturing medium-term notes [S2]. Total cash and marketable securities decreased by approximately $681 million since December 31, 2025, reflecting timing of working capital uses [S2].
The firm continues generating robust operating cash flows exceeding $1.67 billion year-to-date despite slight decreases compared with prior periods reflecting seasonal factors plus changes in working capital items including inventory build-up largely due to supply chain buffer strategies [S24,S26]. Debt maturities related principally to Financial Services obligations are managed prudently via refinancing programs evidenced by recent issuances totaling over $1.38 billion medium-term notes during H1 2026 ensuring smooth liability laddering.
Capital expenditures dropped moderately on a quarterly basis ($138.7 million vs prior year’s higher spending phases) yet full-year forecast remains around $700–$750 million underscoring measured but continued investments into capacity expansions and technology enabling projects supporting future product pipelines including electric powertrain assembly lines [S13,S24]. R&D expenses increased slightly signaling acceleration in innovation efforts particularly around electrification platforms and integrated digital services that enhance total value proposition delivered via connected vehicle technologies coupled with autonomous system capabilities under development.
Overall profitability metrics have faced pressure due to elevated costs partly mitigated through tariffs avoidance strategies but remain healthy supported by premium brand positioning enabling price realization insulation compared against commodity-focused industry players lacking similar defensible moats based on technology leadership combined with integrated services amenities sustaining durable cash generation potential over cycles [S2,S10,S27]
Disclaimer: This report is for informational purposes only reflecting analysis based strictly on publicly available SEC filings dated through July 29, 2026 ([S1],[S2],[S3]) supplemented by corroborating news transcripts ([N1],[N2],[N3]). It does not constitute investment advice or research views.
Disclaimer: This is research-only, informational analysis and not investment advice. It may include AI-generated interpretation and general industry context. Always verify important details using primary sources.

Comments