
Impinj Inc: Navigating Liquidity Strength Amid Persistent Losses and Market Volatility
An in-depth examination of Impinj's financial footing, market dynamics, and operational transparency as it balances liquidity with ongoing net losses.
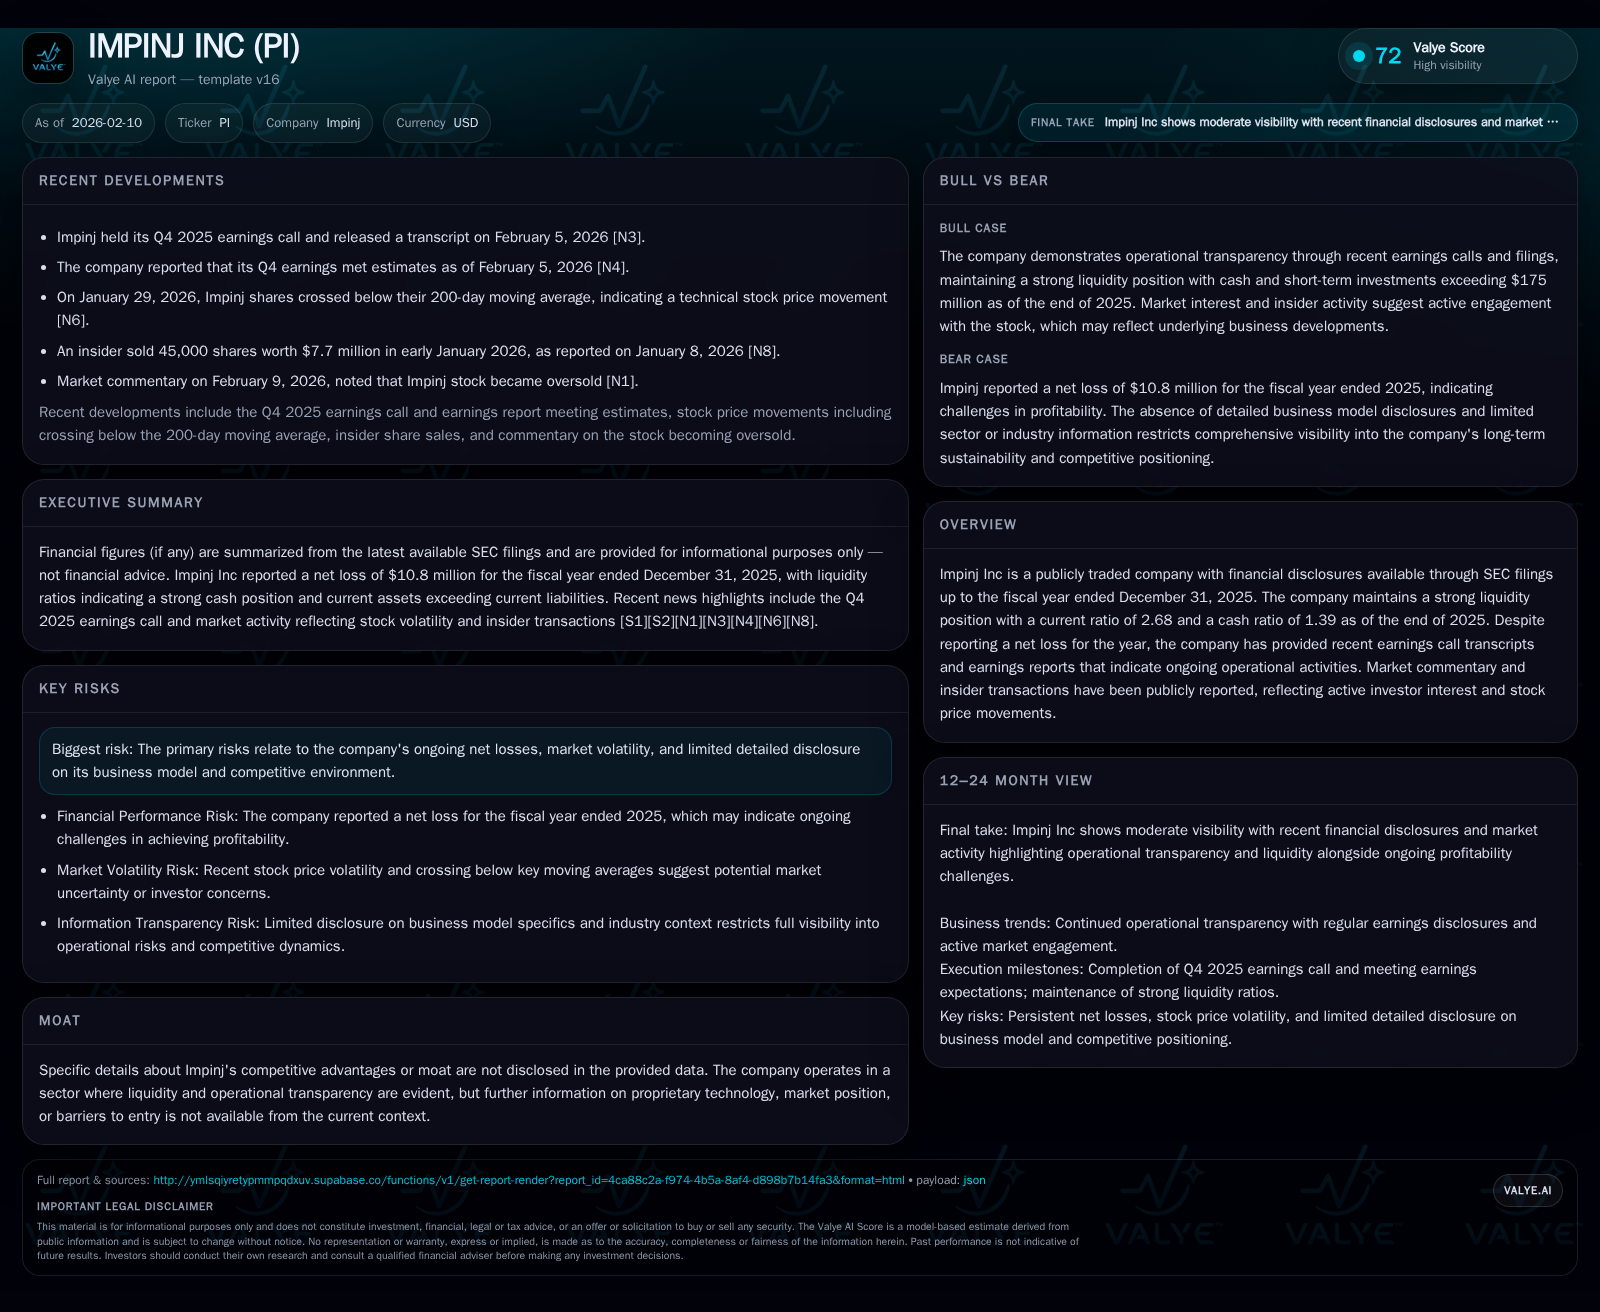
Despite reporting a net loss of $10.8 million for fiscal 2025, Impinj Inc demonstrates robust liquidity metrics, including a current ratio of 2.68 and cash equivalents of $48.2 million, signaling solid capital resilience. Recent trading turbulence, marked by oversold conditions and insider selling worth $7.7 million, reflects heightened investor scrutiny amidst unclear competitive moats. Earnings call insights underscore continued operational activity and a cautious but determined management outlook as the company navigates strategic challenges. The absence of detailed moat disclosures presents analytic headwinds when assessing durable advantages in a dynamic market.
Liquidity vs. Losses: The Financial Balancing Act
Impinj enters the post-2025 fiscal landscape with a strikingly strong liquidity profile juxtaposed against ongoing net losses. The company's balance sheet reveals current assets totaling approximately $339.2 million against current liabilities of $126.5 million, yielding a healthy current ratio of 2.68 — an indicator of substantial short-term financial flexibility [F1]. Additionally, cash and cash equivalents stand robust at $48.2 million, underscoring a reassuring buffer to meet immediate obligations without recourse to external financing.
Yet despite these strengths, Impinj reported a net loss of $10.8 million in 2025 [F1]. This persistent unprofitability signals that operational costs—potentially linked to research & development expenditures, sales efforts, or other overheads—continue to outpace revenues even as the company sustains its core business activities.
From an analytical perspective, this dichotomy highlights a runway rich in capital resilience but shadowed by the imperative need to bridge the profitability gap in forthcoming periods. The available liquidity could provide time to invest strategically or weather near-term headwinds; however, it also raises questions about the sustainability and timing of any eventual financial turnaround.
Market Pulse: Decoding Recent Stock Volatility and Insider Moves
Impinj’s recent share price behavior paints a complex picture of investor sentiment amid fundamental uncertainty. The stock has slipped beneath its 200-day moving average—a technical threshold often perceived as signaling bearish momentum—and has entered distinctly oversold territory according to technical indicators reported earlier this month [N3,N6]. Such conditions imply that market participants may be signaling heightened caution or pessimism about short-term prospects.
Adding nuance to this landscape is insider trading activity: notably, a single insider’s sale of approximately 45,000 shares valued at $7.7 million has drawn attention [N8]. While insider transactions are not inherently predictive of future performance, substantial sales can influence market perceptions regarding management’s confidence or intended capital allocation.
News coverage exploring precipitous share declines relates such drops to broader sector pressures as well as company-specific developments that have yet to fully stabilize investor expectations [N4,N7]. The confluence of technical selling pressure and internal share reductions contributes to an atmosphere marked by skepticism but also opportunity for contrarian investors adopting options strategies hoping for reversion [N5].
In aggregate, these signals underscore a market grappling with Impinj’s fundamental trends while parsing layers of sentiment-driven trading behaviors.
Operational Transparency: What Earnings Calls Reveal
The Q4 2025 earnings call transcript offers valuable direct insight into Impinj’s internal narrative amidst lingering financial challenges [N1,N2]. Management disclosed that revenues met market expectations—a modest positive anchor—while drawing explicit attention to sustained investments in research and development aimed at fortifying product offerings and expanding addressable markets.
Cost controls remain an active focus area; however, management conveyed measured optimism tempered by recognition that margins have yet to reach desired thresholds. No sweeping revisions were made to guidance, suggesting calibrated confidence founded on ongoing innovation pipelines but cognizant of external macroeconomic uncertainties.
Importantly, executives were forthcoming about persistent losses but framed them within a multi-quarter investment horizon needed for transformative growth initiatives. Such candor lends credibility and operational transparency that some investors may find reassuring amid otherwise opaque public data.
Unpacking the Unseen: Absence of Clear Moat and Strategic Challenges
One complicating factor inherent in analyzing Impinj is the absence of explicitly documented competitive moats or sustainable differentiators within publicly disclosed data sets [valye_report_excerpt]. This lack of clarity handicaps attempts to definitively characterize the company's defensibility against competitors or susceptibility to sector entrants.
Given the nature of technology-driven markets where intellectual property protection, customer entrenchment, or scale economies often form key barriers, this opacity suggests either early-stage competitive positioning or intentional conservatism in communications.
From an analyst standpoint, this is a material caveat — without clear moat evidence one must approach projections cautiously and place greater emphasis on observable financial fundamentals and management commentary rather than presumed structural advantages.
Risk Factors Beyond the Numbers
The company’s latest SEC filings reiterate material risks typical for firms oscillating between investment phases and profitability milestones [S1]. These encompass ongoing net losses that could pressure liquidity if unabated; potential volatility stemming from sector cyclicality; and operational transparency limitations which may exacerbate analyst uncertainty.
Moreover, risks related to product adoption cycles, competitive responses from larger incumbents or emergent firms, and macroeconomic influences further compound exposure pathways documented under Item 1A Risk Factors [S1].
Market participants should weigh these documented vulnerabilities alongside liquidity strength when framing risk/reward scenarios.
Valuation Through the Noise: Investor Sentiment and Trading Dynamics
Recent options market activity reveals nuanced investor behavior masked from straightforward price metrics alone [N5]. Strategies committing to buy shares at approximately $110 per share — accompanied by targeted yield capture techniques — indicate some segment of sophisticated investors viewing current dips as temporary dislocations amenable to structured upside participation.
This tactic implicitly reflects belief in eventual fundamental stabilization or improved earnings trajectories despite existing headline negatives.
Such derivative commitments can provide additional liquidity context and help interpret underlying sentiment shifts beyond raw share price movements.
Looking Ahead: Forecasts and Investor Considerations
Impinj’s Q3/early Q4 filings feeding into full-year disclosures provide preliminary indications on near-term quarterly performance nuances [S2]. Coupled with management forward-looking statements from earnings calls [N1], the company's path involves carefully balancing aggressive investment against prudent cost controls.
While unresolved profitability tensions linger, management’s approach suggests focus on scalable revenue drivers supported by R&D innovation fosters cautious optimism. For buy-side professionals evaluating Impinj from an operational standpoint, vigilance around evolving margin profiles alongside continued monitoring of insider actions and technical trading patterns will remain critical.
Realistic scenarios acknowledge extended periods before stable profit generation aligns with robust cash flow conversion — making liquidity health an essential underpinning during this interval.
Disclaimer: This analysis is intended solely for informational purposes based on publicly available data through February 2026 and does not constitute investment advice or recommendations.
Disclaimer: This is research-only, informational analysis and not investment advice. It may include AI-generated interpretation and general industry context. Always verify important details using primary sources.

Comments