
Papa Johns: Franchise Economics, Margin Pressures, and the Stakes of Transformation in a Saturated Pizza Market
Papa Johns faces the dual challenge of reinvigorating profitability amid competitive headwinds and operational cost inflation, while executing strategic transformation programs to drive long-term growth.
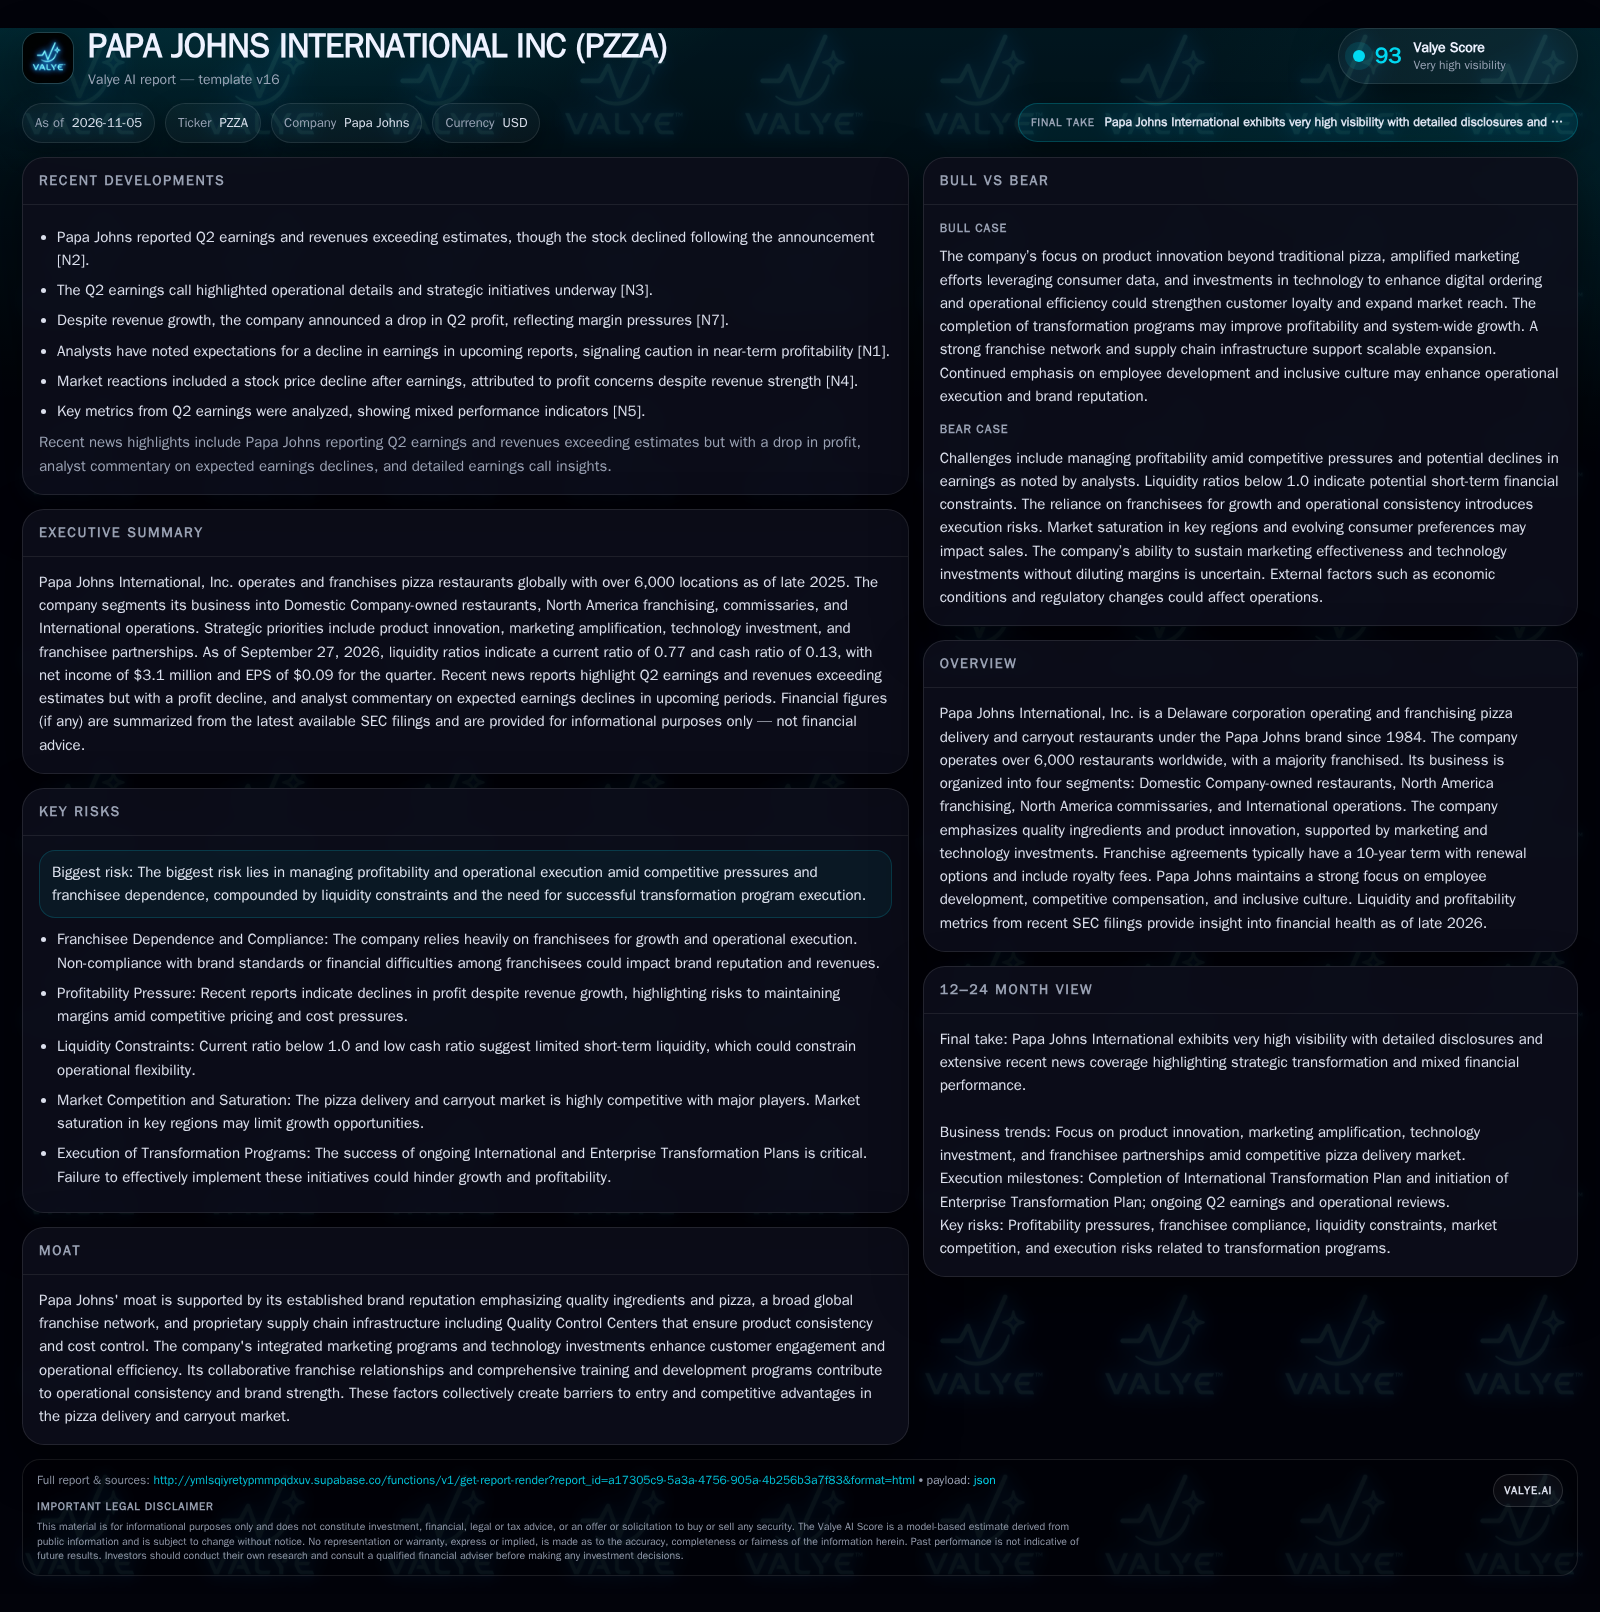
Recent results show Papa Johns delivering revenue outperformance but suffering profit declines, highlighting ongoing margin pressure. The company’s global franchise system, with over 6,000 locations, provides scale, but short-term liquidity metrics are weak. Execution of recently completed and ongoing transformation programs, along with the ability to drive higher franchisee unit economics, will determine whether the brand can regain operational momentum and improve earnings.
Papa Johns International enters late 2026 at a strategic crossroads: while its vast franchise network and proprietary supply chain give it scale and brand reach, the company faces acute margin pressures and underwhelming profitability despite solid topline performance. The stakes are high in a pizza market where digital engagement, cost control, and customer experience are fiercely contested.
Recent Margin Compression and Transformation Efforts Define the Current Landscape
Papa Johns reported 6,083 restaurants in operation across 50 countries and territories as of year-end 2025, with 475 company-owned and 5,608 franchised units [S1]. The franchise-heavy mix underpins the company’s asset-light growth model but also makes systemwide economics sensitive to franchisee health and alignment.
For the quarter ended September 27, 2026, net income fell to $3.1 million (EPS: $0.09), and the company’s liquidity profile showed a current ratio of 0.77 and a cash ratio of 0.13 [S2]. The company reported cash and liquidity metrics for the period; these figures do not by themselves establish operating runway, investment capacity, financial flexibility, or financing capacity.
Recent quarters saw revenue outperformance but profit declines, with analysts and headlines highlighting margin pressures and forecasting continued earnings softness [N2] [N7] [N1]. This dynamic reflects rising costs and competitive intensity, which are not being fully offset by sales growth.
The company recently completed an International Transformation Plan and has begun implementing an Enterprise Transformation Plan aimed at operational modernization and cost control [S1]. These programs are intended to address profitability and growth challenges, but their impact remains to be demonstrated.
How Franchise Fees, Supply Chain Control, and Store Economics Shape Profit Potential
Papa Johns’ core earnings engine combines franchise royalties, commissary sales, and direct profit from company-owned stores. Franchise agreements typically feature a 5% royalty on gross revenue (sometimes reduced by incentives), providing a relatively stable stream as long as system sales are healthy [S1].
Company-owned restaurants reported average unit sales of $1.3 million in 2025, while North American franchises generated $1.1 million per unit [S1]. This gap likely reflects operational differences, store mix, and local market conditions. Higher company-owned unit sales can boost segment margins, but the majority-franchised model means systemwide profitability depends on franchisee economics and retention.
The company operates 12 Quality Control Centers (QC Centers) in North America, supplying dough, sauce, and other essentials. This vertically integrated supply chain is intended to ensure quality and cost control, potentially providing margin stability and a lever for systemwide consistency [S1]. However, it also introduces fixed costs that are sensitive to volume swings.
Papa Johns’ cost structure is affected by commodity inputs (cheese, wheat, labor), marketing spend, and technology investments. While digital ordering and operational tech can drive efficiency and ticket size, ongoing investment is needed to keep pace with consumer expectations and competitors’ capabilities.
Brand, Product Innovation, and Franchise Network: Competitive Advantages and Counterforces
Papa Johns’ competitive position rests on its global scale, brand reputation for quality ingredients, and a broad franchise network. The company’s proprietary supply chain and consistent product standards create some barriers to entry, particularly for smaller or regional pizza chains [S1].
Product innovation—such as new menu items and customization options—can differentiate the brand and attract new customers, but the pizza delivery and carryout space is highly competitive and price-sensitive. Incumbents and digital-native rivals alike are investing heavily in mobile ordering, loyalty programs, and marketing.
The company’s integrated marketing programs, leveraging both digital and traditional channels, aim to sustain brand relevance. However, competitors in the quick-service pizza space (including Domino’s, Pizza Hut, and regional players) are also pursuing technology-driven engagement and delivery innovation, limiting the scope for sustainable differentiation.
Franchisee relationships are both a strength and a vulnerability: a large, engaged network supports rapid expansion and operational scale, but execution risk is elevated if franchisees struggle with profitability, compliance, or local market adaptation.
If Transformation Delivers: Operational Efficiencies and Franchisee Alignment Drive Earnings Upside
A favorable scenario unfolds if the Enterprise Transformation Plan succeeds in reducing operating costs, optimizing store labor and supply chain expenses, and driving sales mix toward higher-margin items. Improved technology could enhance digital ordering conversion, raise average ticket size, and cut delivery errors.
Franchisee alignment—supported by training, marketing, and supply chain reliability—could accelerate new unit openings and systemwide sales growth. If the company’s product innovation and marketing efforts resonate, Papa Johns may gain share from less agile competitors, especially in international markets where penetration remains lower.
Confirmation would come from sequential margin expansion, rising franchisee same-store sales, and evidence of improved cash flow conversion. A meaningful uptick in average unit sales, both company-owned and franchised, would further validate the turnaround. If the company can also rebuild its liquidity buffer while investing in growth, the market could reward operational leverage with multiple expansion.
Maintaining Share in a Competitive, Margin-Pressured Market
The most plausible outcome is that Papa Johns stabilizes its profitability through incremental improvements in operations and cost control, but faces ongoing margin pressure from commodity inflation and competitive discounting. Franchisee economics remain sufficient to support network stability, but aggressive new unit growth is limited by local saturation and cautious franchisee investment.
Product innovation and digital engagement help maintain relevance, but do not produce a step-change in market share. The company continues to invest in technology and marketing, but with tight liquidity, capital allocation remains constrained.
Evidence would include flat to modestly rising systemwide sales, stable (but not expanding) operating margins, and a gradual rebuild of the cash position. Franchisee attrition remains low, but net new openings are limited. The Enterprise Transformation Plan delivers some cost savings, but not enough to fully offset external headwinds.
Margin Erosion and Franchisee Strain Undermine Network Stability
The adverse scenario materializes if cost inflation (labor, ingredients, delivery logistics) outpaces pricing power, driving further margin compression. Franchisee economics deteriorate, leading to store closures, reduced compliance with brand standards, or disputes over royalties and supply costs.
If transformation initiatives fail to deliver meaningful savings or improved sales productivity, the company may be forced to cut back on marketing or technology investment, further eroding competitiveness. Liquidity constraints could require asset sales, cost-cutting that harms brand equity, or unfavorable financing.
Confirmation would be visible in declining franchisee same-store sales, rising store closures or franchisee disputes, negative operating cash flow, and worsening liquidity ratios. Loss of market share to digitally native or better-capitalized competitors would reinforce the adverse thesis.
Benchmarks for Testing Papa Johns’ Transformation and Profitability Narrative
Track quarterly trends in systemwide same-store sales growth, segmented by company-owned and franchised units.
Monitor gross and operating margin progression, with special attention to cost of goods sold (COGS) and labor as a percentage of sales.
Watch liquidity metrics, including cash balance and current ratio, for signs of improvement or further tightening.
Assess net new unit openings and closures, particularly in international markets where growth potential is higher.
Follow franchisee health indicators—such as royalty payment timeliness, compliance rates, and public franchisee sentiment—if disclosed.
Evaluate the tangible impact of Enterprise Transformation Plan milestones (cost savings, tech rollout, supply chain efficiency) in quarterly reports.
Monitor competitive pricing dynamics and promotional intensity in the pizza segment for signs of margin risk or opportunity.
A useful metric would be digital order mix and customer retention rates to gauge the effectiveness of tech and marketing investments.
Disclaimer: This is research-only, informational analysis and not investment advice. It may include AI-generated interpretation and general industry context. Always verify important details using primary sources.

Comments