
Qnity Electronics in 2026: Volume Expansion, Cost Leverage, and the Stakes of Transformation in a Shifting Semiconductor Landscape
Qnity Electronics is capitalizing on surging demand for advanced semiconductor and interconnect materials, with robust volume-driven growth and improved cost efficiency in 2026. The company’s multi-year transformation plan and exposure to fast-evolving AI and packaging markets offer upside, but significant debt, rising SG&A, and macro/geopolitical risks remain critical variables for future performance.
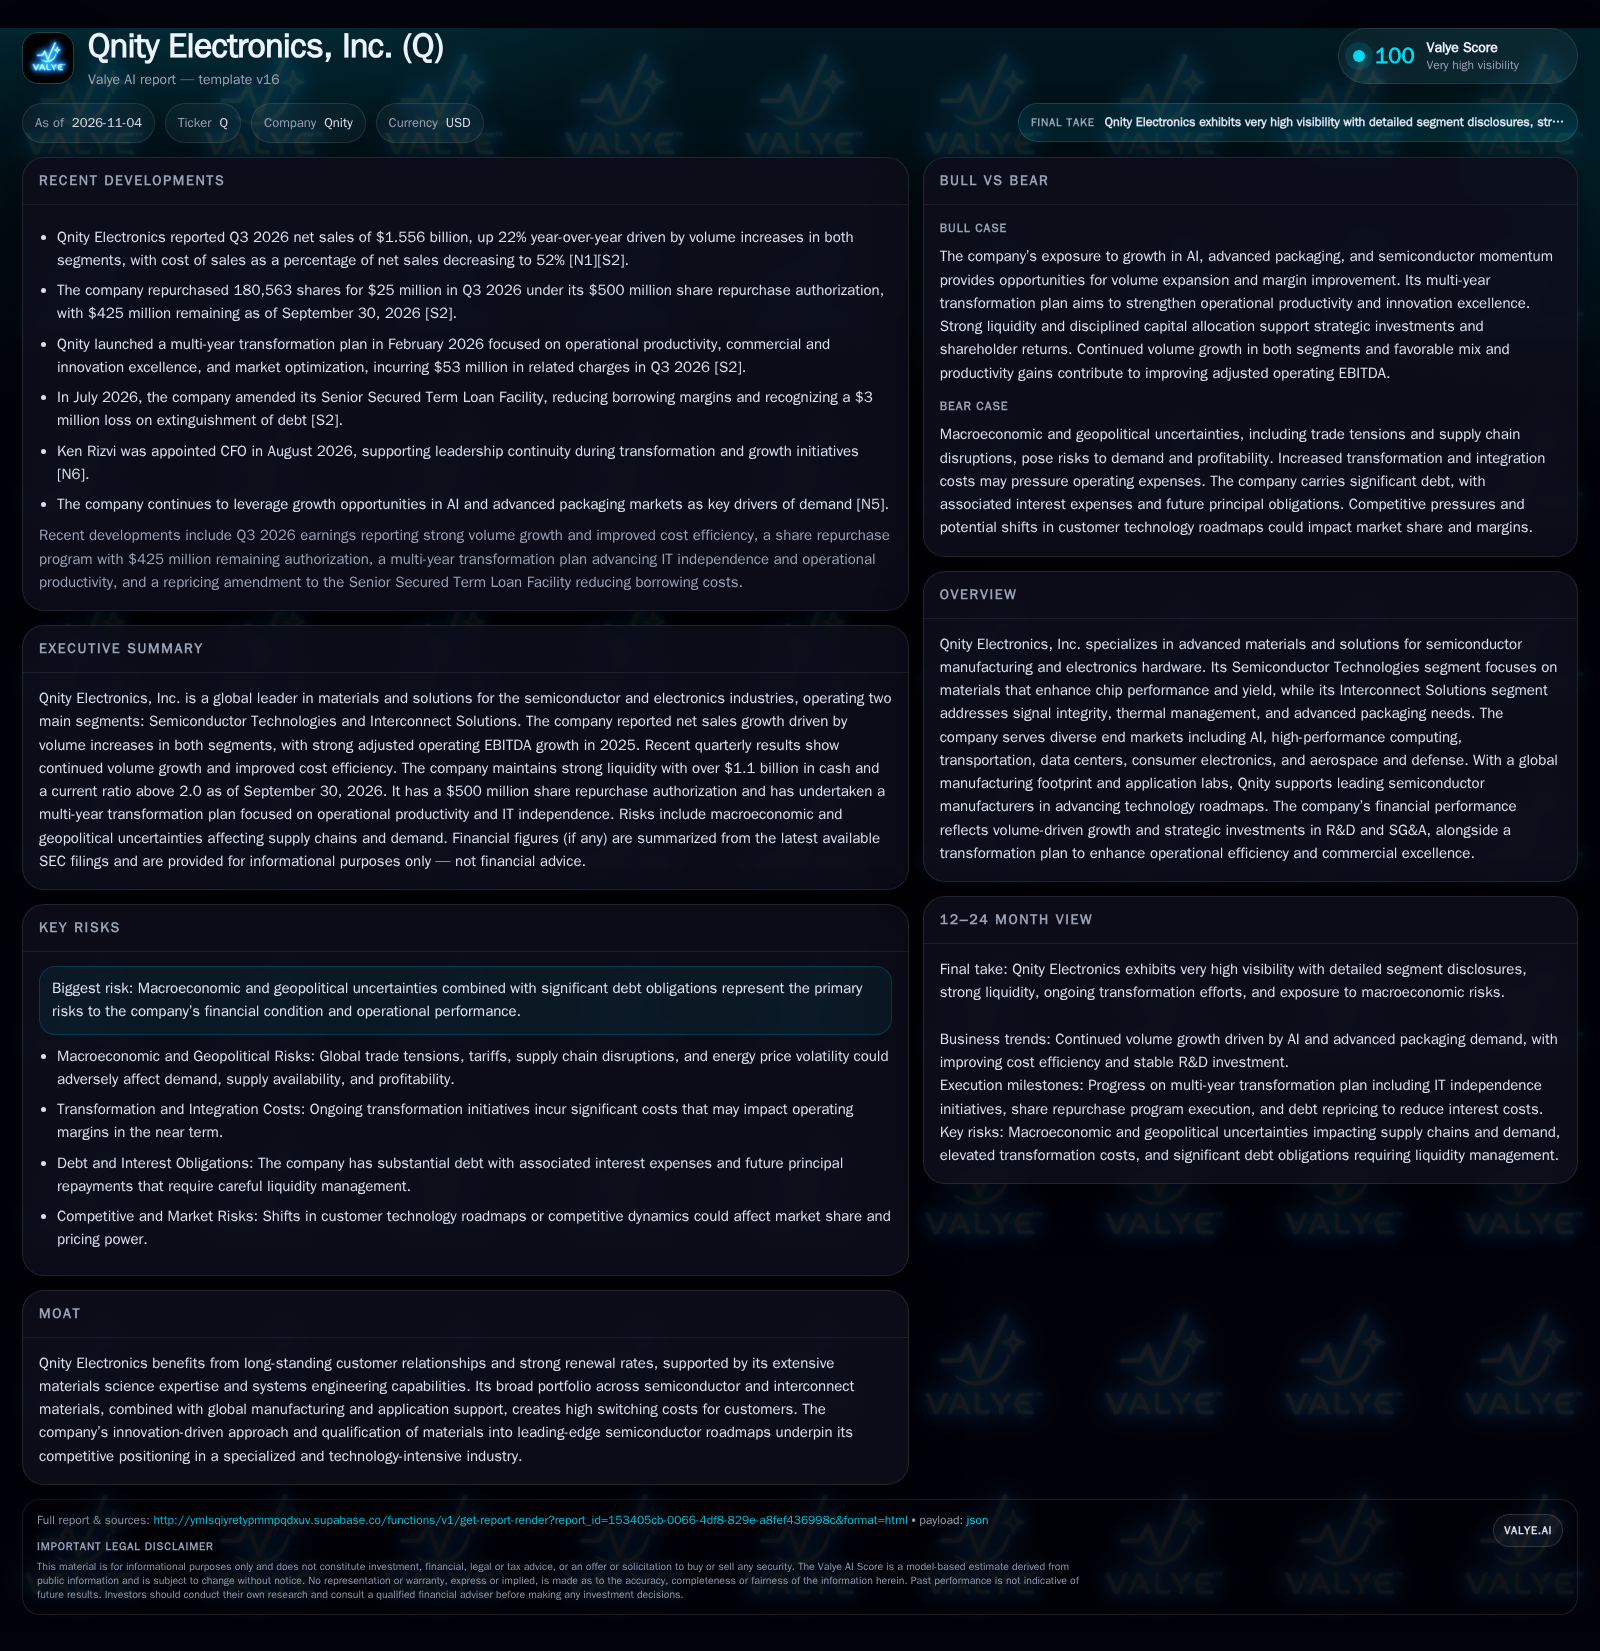
Qnity Electronics posted 22% year-over-year sales growth in Q3 2026, driven by strong volume increases in both its Semiconductor Technologies and Interconnect Solutions segments. However, execution risks from transformation costs, elevated debt, and external macro pressures could shape the company’s trajectory as it seeks to leverage growth in AI and advanced packaging markets. [S2] [N1] [N5]
Qnity Electronics, Inc. stands at a pivotal juncture in late 2026, harnessing robust demand for semiconductor and electronics materials—particularly in AI and advanced packaging—while navigating the complexities of transformation, debt management, and external macro risks. Recent results highlight strong double-digit volume growth, operational cost improvements, and significant investments in transformation initiatives. Yet, the company’s future trajectory hinges on its ability to sustain commercial and cost momentum, execute its transformation plan without margin dilution, and manage both its sizable debt load and the unpredictable macro environment. This analysis dissects how Qnity’s business model, end-market positioning, and capital allocation could shape its value creation prospects over the next several years.
Q3 2026: Volume Surge, Efficiency Gains, and Transformation Charges Define the Present
The most material current facts for Qnity Electronics are: (1) net sales of $1.556 billion in Q3 2026, up 22% year-over-year, underpinned by volume increases of 29% in Interconnect Solutions and 16% in Semiconductor Technologies; (2) cost of sales as a percentage of net sales dropped to 52%, from 55% a year earlier, reflecting improved operational efficiency; (3) transformation, integration, and related charges ballooned to $53 million in Q3, tied to a multi-year transformation plan; and (4) liquidity remained strong with $1.124 billion in cash and a current ratio of 2.09 as of September 30, 2026 [S2] [N1].
These facts matter because they illuminate both the strength in Qnity’s core end-market demand and the operational/cost levers the company is pulling to support margin expansion. The company reported cash and liquidity metrics for the period; these figures do not by themselves establish operating runway, investment capacity, financial flexibility, or financing capacity. [S2] [S1]
How Qnity Converts Volume into Profits: Pricing, Mix, and the Role of Scale
Qnity’s revenue model is anchored in supplying advanced materials and solutions to semiconductor manufacturers and electronics hardware producers. The company’s economics are heavily volume-driven: recent growth was attributed primarily to higher shipment volumes in both operating segments [S2]. This points to a business where end-market demand—especially in AI, advanced packaging, and high-performance computing—directly drives top-line expansion.
Pricing power in materials and electronic solutions is often constrained by customer concentration, intense qualification cycles, and cyclical procurement. However, Qnity’s ability to reduce cost of sales as a percentage of net sales suggests it is capturing scale-driven efficiencies, likely through operational productivity, supply chain optimization, and perhaps a favorable product mix shift toward higher-value offerings. The Interconnect Solutions segment’s 20% adjusted operating EBITDA growth on 12% revenue growth hints at significant operating leverage, especially as fixed costs are spread over a larger sales base [S2].
SG&A expenses have risen (up to $200 million in Q3 2026 from $159 million a year prior), and transformation charges are non-trivial at $53 million for the quarter. These costs could be temporary if transformation delivers future productivity, but if persistent, they could offset margin gains from volume and efficiency. Capital needs remain significant due to R&D (7% of net sales), ongoing transformation, and debt service. The company’s substantial debt ($4.0 billion at end of 2025) creates a structural fixed-cost burden, making cash flow generation and cost discipline critical to value creation [S2] [S1].
Defensible Positioning in a High-Stakes Supply Chain: Moats and Threats
Qnity’s competitive position is built on deep materials science expertise, long-term customer relationships, and qualification in leading-edge semiconductor roadmaps, creating high switching costs for major OEM customers [S2]. The company’s broad portfolio—spanning both semiconductor and interconnect materials—enables it to capture value across multiple stages of the electronics value chain. Its global manufacturing and support footprint further embeds Qnity in customer supply chains, which is particularly valuable in a world of supply chain disruptions and geopolitical volatility.
However, the industry is fiercely competitive, with large diversified materials companies, regional players, and potential substitutes (such as alternative packaging or interconnect technologies) vying for share. Customer technology roadmaps can shift rapidly—especially in AI and advanced packaging—potentially eroding the longevity of current product relevance. If a major customer adopts a new technology or supplier, Qnity could face abrupt volume or pricing pressure. The company’s ability to maintain qualification status and innovate faster than competitors will determine whether its switching costs translate into durable economic profit.
Additionally, as AI and advanced packaging become more central, new entrants or adjacent players may target the same high-growth areas, increasing the risk of margin compression or share loss if Qnity cannot sustain a technical or relationship edge.
Transformation Payoff and AI-Led Demand Could Catalyze Margin Expansion
If Qnity executes its transformation plan effectively—delivering sustained operational productivity, commercial excellence, and IT independence—while end-market demand for AI and advanced packaging continues to surge, the company could realize significant operating leverage and margin expansion. The causal chain would be: continued double-digit volume growth (especially in Interconnect Solutions and advanced packaging), cost of sales ratio improvement from productivity and scale effects, and transformation charges tapering off after initial investments.
Evidence that would confirm this scenario includes: (1) sustained revenue growth outpacing the broader semiconductor supply chain; (2) further declines in cost of sales as a percentage of net sales; (3) stabilization or reduction in SG&A as a percent of sales post-transformation; and (4) rising adjusted operating EBITDA margins, particularly in segments exposed to AI and high-performance computing. Additional signs would be increased share repurchase activity (using the $425 million remaining authorization) and R&D investment translating into new product wins or customer qualifications in next-gen chip architectures [S2] [N5].
Falsification would come from a failure to demonstrate margin expansion despite revenue growth, persistent transformation charges, or evidence that AI/packaging momentum is not translating into incremental sales or margins for Qnity.
Volume Growth Balances Rising Costs as Transformation Progresses
The most plausible outcome is that Qnity continues to benefit from healthy end-market demand—especially in AI, data centers, and advanced packaging—driving steady volume and revenue growth. Cost of sales efficiency may improve incrementally as transformation initiatives yield productivity, but SG&A and periodic transformation charges likely remain elevated through 2027 as the company completes its multi-year plan.
Under this scenario, adjusted operating EBITDA grows in line with sales, but margin gains are modest as cost savings are partially offset by higher corporate expenses. Debt service remains a manageable but persistent drag on free cash flow, and liquidity is maintained through disciplined capital allocation, with share repurchases and M&A opportunities pursued opportunistically. The company’s competitive position is preserved, but not dramatically strengthened, as peers also invest in innovation and customer relationships.
This scenario would be confirmed by continued high-single-digit to low-double-digit revenue growth, stable or slightly improving gross margins, and SG&A trending as a consistent fraction of sales. Evidence to the contrary would include stagnating sales growth, persistent cost inflation, or a material deterioration in liquidity or debt metrics.
Execution Slips or Macro Shocks Could Erode Margins and Strain Liquidity
If macroeconomic or geopolitical shocks (trade tensions, supply chain disruptions, energy price spikes) sharply curtail demand, Qnity could experience volume declines or pricing pressure, particularly if customers delay investments in new chip technologies. Simultaneously, if transformation costs escalate or productivity gains fail to materialize, operating margins could contract even as revenue stagnates or falls.
A key risk is that the company’s substantial debt load becomes more burdensome if cash flows weaken, potentially forcing reductions in R&D, strategic investment, or even the share repurchase program. Negative leverage could result if fixed costs (debt service, SG&A) remain high while gross profit compresses.
Signs confirming this downside would be: (1) flat or declining segment volumes; (2) cost of sales or SG&A ratios rising; (3) ongoing transformation charges with no offsetting margin gains; and (4) liquidity metrics deteriorating (declining cash balances, tighter current ratio). Falsification would require evidence that Qnity maintains or grows sales and margins despite exogenous shocks and transformation headwinds.
Progress Markers for Qnity’s Transformation, Competitive Edge, and Demand Capture
Quarterly volume growth rates in both Semiconductor Technologies and Interconnect Solutions—particularly the sustainability of double-digit increases.
Cost of sales as a percentage of net sales: further improvement would signal operational leverage; a reversal could indicate cost pressure or inefficiency.
Magnitude and duration of transformation, integration, and other non-recurring charges: persistence or escalation would challenge the thesis that the transformation plan is margin-accretive.
SG&A as a percentage of net sales: stabilization or decline would suggest transformation benefits; continued increases could undermine operating leverage.
Adjusted operating EBITDA margins by segment—especially in Interconnect Solutions, where recent leverage has been strongest.
R&D investment as a share of sales and evidence of new product wins or customer qualifications in next-generation semiconductor and packaging technologies.
If disclosed, customer concentration and renewal rates: shifts could signal changes in competitive position or end-market risk.
Disclaimer: This is research-only, informational analysis and not investment advice. It may include AI-generated interpretation and general industry context. Always verify important details using primary sources.

Comments