
Reynolds Consumer Products in Late 2026: Margin Resilience, Commodity Pressures, and the Stakes of Retail Concentration
Reynolds Consumer Products maintains leading U.S. market positions and strong brand equity across disposable household goods, but faces a pivotal period as margin gains from pricing and productivity contend with $400 million in commodity cost headwinds and significant customer concentration. The company’s ability to sustain operational leverage, integrate recent acquisitions, and defend shelf space in a mature, competitive environment will shape its medium-term trajectory.
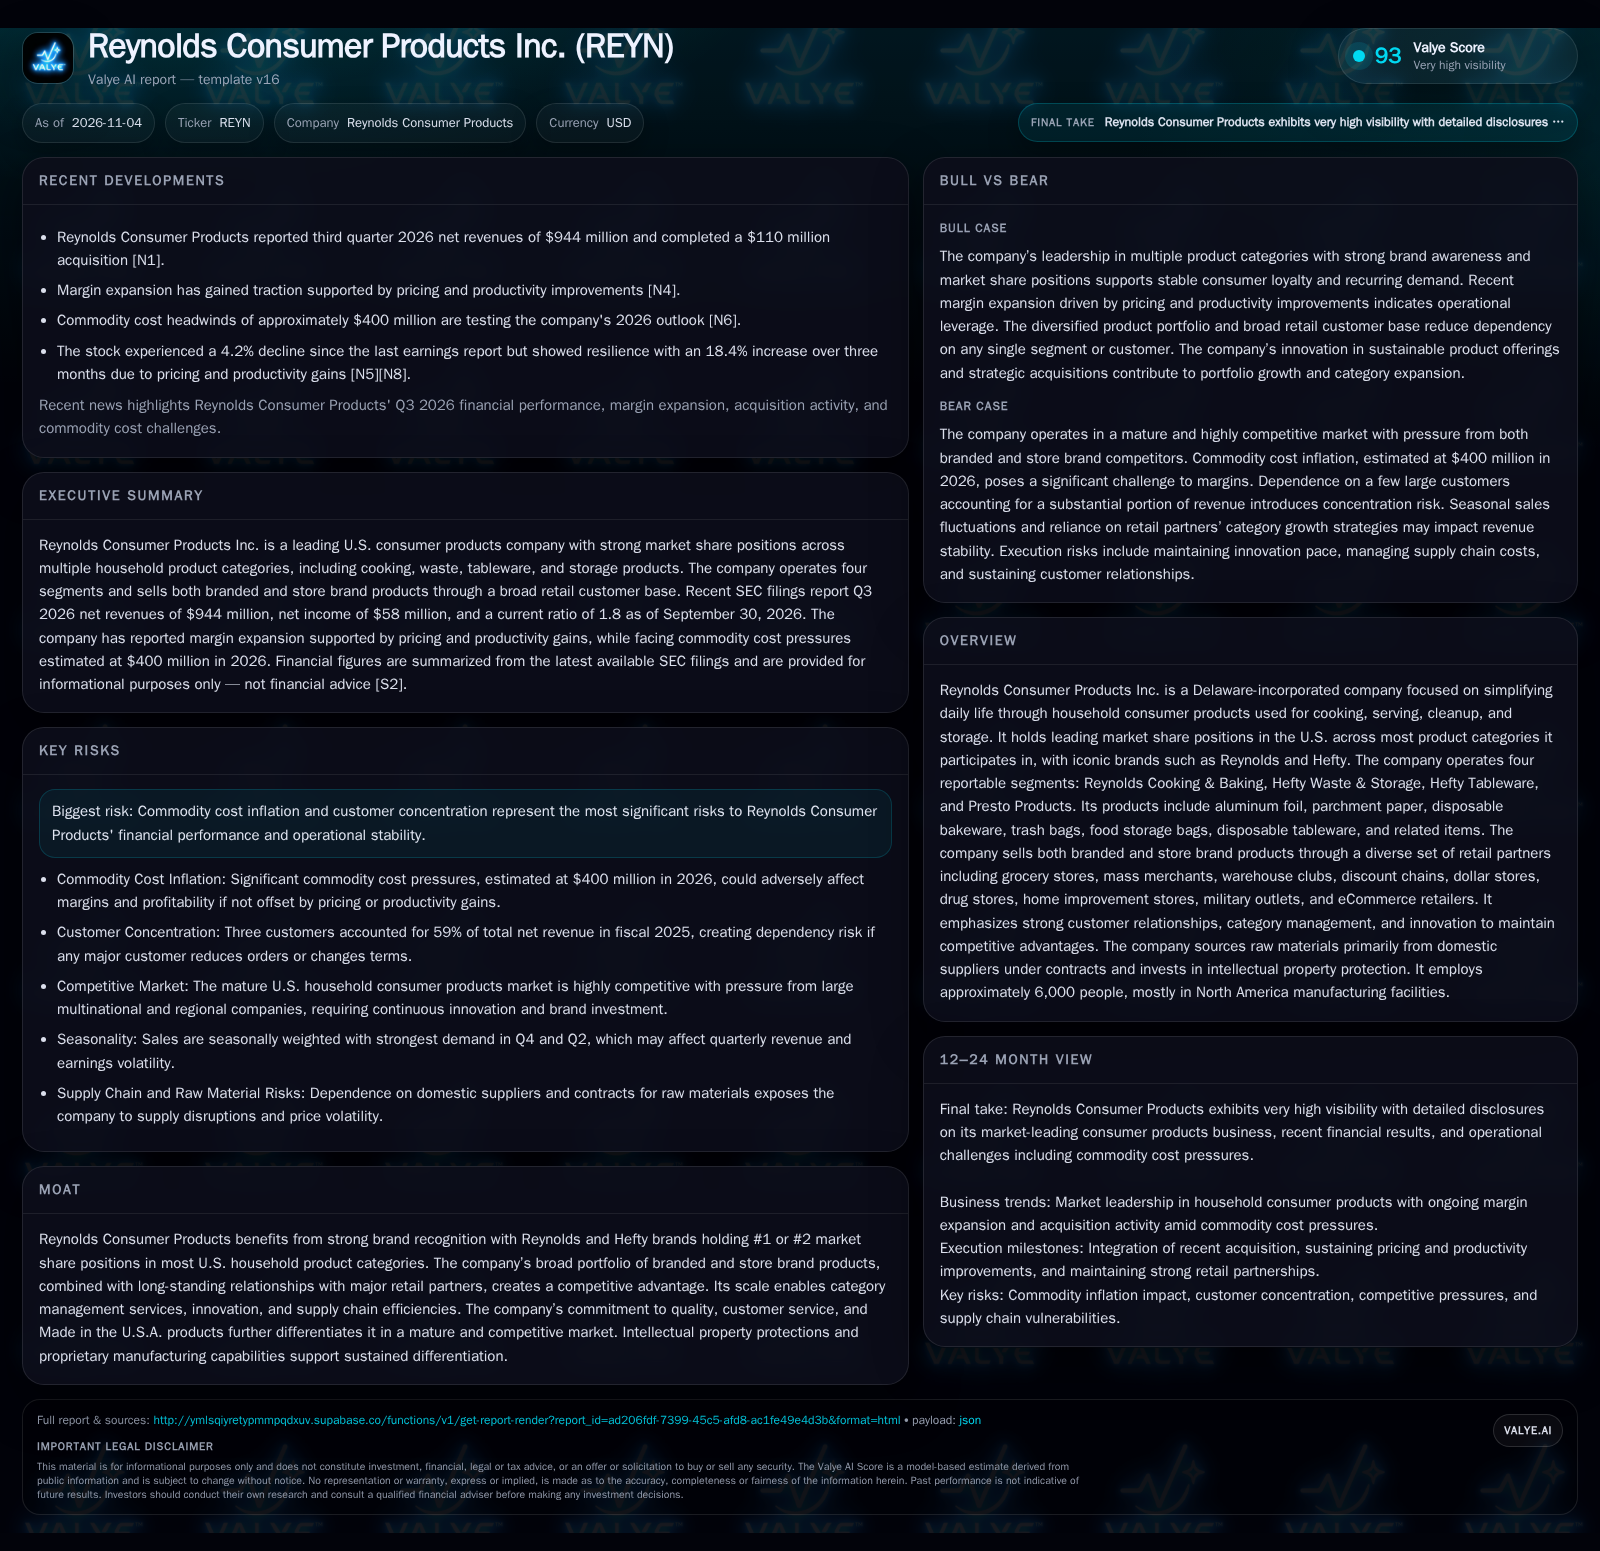
Reynolds Consumer Products reported Q3 2026 net revenues of $944 million and completed a $110 million acquisition, as margin expansion from pricing and productivity improvements contends with $400 million in forecast commodity cost inflation. Customer concentration remains high, amplifying execution risk in a mature, competitive U.S. household goods market. The company’s next phase will test its ability to balance cost recovery, customer relationships, and category leadership [N1] [N4] [N6].
Reynolds Consumer Products stands at a crossroads as it leverages iconic brands and deep retail relationships to defend and grow its share in the mature U.S. household products market. The company’s recent financials reflect both resilience—margin expansion driven by pricing and productivity—and vulnerability, with $400 million in commodity cost headwinds and significant customer concentration. As Reynolds integrates a new acquisition and navigates competitive dynamics, its ability to sustain operational leverage and defend its market position will be closely tested in the coming quarters.
Recent Performance and Emerging Pressures Shape the Near-Term Outlook
The company reported Q3 2026 net revenues of $944 million, with net income of $58 million and EPS of $0.28, reflecting continued scale in core categories [S2]. Margin expansion has gained traction, supported by pricing actions and productivity improvements, but is now being tested by approximately $400 million in anticipated commodity cost inflation for the year [N4] [N6]. Reynolds also completed a $110 million acquisition, signaling ongoing portfolio development and a willingness to deploy capital for growth [N1]. Customer concentration remains pronounced, with three customers accounting for over 10% of total net revenue in fiscal 2025 and the top two concentrated in Hefty segments. This dynamic amplifies exposure to shifts in retail partner strategies [S1].
How Reynolds Makes Money: Brand Premiums, Scale—and Cost Headwinds
Reynolds Consumer Products generates revenue from a mix of branded and store brand household products spanning cooking, waste, storage, and tableware categories. The business model relies on high-volume, relatively low-margin goods, where category leadership and brand equity—especially for Reynolds and Hefty—support some premium pricing power. However, the company must balance this with the price sensitivity typical of mature consumer staples and the negotiating leverage of large retail partners. Product mix is a key lever: branded lines often offer higher gross margins than private label, but require ongoing investment in marketing and innovation.
Operating leverage can be realized through scale-driven efficiencies in manufacturing and distribution, especially as productivity initiatives take effect. Margin improvements in recent quarters suggest successful cost recovery via pricing and productivity, but these gains are at risk if commodity inflation remains elevated or if competitive discounting intensifies. The company’s capital needs are moderate, with some incremental investment required for plant modernization, innovation, and integration of acquisitions. However, working capital swings—especially in periods of commodity price volatility—can affect cash flow. The company reported cash and liquidity metrics for the period; these figures do not by themselves establish operating runway, investment capacity, financial flexibility, or financing capacity. [S2]
Defending Shelf Space: Brand Equity, Retail Relationships, and the Threat of Substitution
Reynolds’ strongest competitive advantages stem from its household brand recognition—98% U.S. brand awareness for Reynolds foil and #1 or #2 market share in most categories—and long-standing relationships with a broad set of retail partners. This scale enables the company to offer category management, reliable supply, and frequent innovation, helping it defend shelf space against both branded rivals and private label encroachment [S1].
However, the U.S. household products market is mature and intensely competitive, with rivals ranging from large multinationals (e.g., Clorox, S. C. Johnson) to regional and private label manufacturers. Price, quality, and innovation remain the principal battlegrounds. Substitution risk is real: many Reynolds and Hefty products are functionally similar to private label alternatives, and retailer consolidation gives buyers leverage to demand price concessions or shift shelf allocation. The company’s commitment to "Made in the U.S.A." and differentiated product innovation (such as compostable options) may blunt some of this risk, but sustained investment is required to maintain relevance and pricing power.
If Productivity and Pricing Outpace Commodity Inflation, Margin Upside Persists
The most favorable scenario for Reynolds is one in which pricing actions and productivity improvements continue to outpace the $400 million in annual commodity cost headwinds, sustaining or even expanding operating margins. This would likely require disciplined execution on cost initiatives, incremental innovation that justifies shelf premiums, and stable relationships with key retail partners—especially if the recent $110 million acquisition brings synergy realization or category expansion [N1] [N4] [N6].
Confirmation would come from: (a) sustained gross and operating margin improvement in the next two quarters, (b) evidence that volume declines are limited even as prices rise, (c) successful integration of the new acquisition without material disruption, and (d) resilience in shelf space and promotional support from major retailers. Analyst and management commentary pointing to successful cost pass-through and stable or growing market share would also validate this scenario.
Margin Recovery Holds, but Growth Plateaus Amid Competitive and Cost Pressures
The most plausible path is that Reynolds sustains modest margin gains from recent pricing and productivity measures, offsetting—though not fully overcoming—commodity inflation. Revenue growth is likely to be incremental, driven more by mix and occasional category expansion than by broad market growth, consistent with the mature state of the U.S. household products sector.
This scenario assumes that the company retains its leading shelf positions in core categories, but faces occasional volume trade-offs as price-sensitive consumers shift to store brands or as retailers experiment with private label promotions. Acquisition integration proceeds without major setbacks, but synergies are gradual. Confirmation would come from quarterly results showing stable margins, modest top-line growth, and no major customer losses or shelf space reductions. Falsification would be evident if margin gains reverse, volume drops sharply, or if customer concentration risks materialize via lost contracts or unfavorable renegotiations.
Commodity Shocks and Retailer Consolidation Expose Margin and Volume Fragility
A negative outcome could emerge if commodity cost inflation proves more persistent or severe than expected, outstripping Reynolds’ ability to recover costs via pricing or productivity. In this case, operating margins could compress, especially if competitive intensity forces price concessions or if retailers accelerate private label substitution.
Customer concentration compounds the risk: the loss or reduction of a major retail partner—especially in Hefty segments—would have immediate revenue and margin impact, and could trigger a negative feedback loop of shelf space loss and reduced brand visibility. Confirmation of this scenario would come from declining gross and operating margins, pronounced volume declines in core categories, or public disclosures of lost or renegotiated customer contracts. Early warning signs include sharp promotional activity, retailer inventory destocking, or management guidance downgrades.
What Will Determine Reynolds’ Staying Power in U.S. Household Products?
Gross margin and operating margin trends over the next two quarters, especially as commodity cost pass-through and productivity gains are tested against ongoing inflation.
Volume trends in core branded categories (Reynolds foil, Hefty trash bags, Hefty tableware)—a useful metric would be disclosed volume/mix detail to determine if pricing is eroding unit sales.
Customer concentration metrics: any change in the number or revenue share of customers accounting for more than 10% of sales, or public disclosure of major contract renewals or losses.
Integration milestones and synergy realization from the $110 million acquisition, including category expansion or cost savings if disclosed.
Shelf space and promotional support from top retail partners, as indicated by management commentary or retailer disclosures.
Raw material and commodity cost inflation rates, and the company’s ability to renegotiate supplier contracts or diversify sourcing.
Innovation pipeline: the commercial rollout and consumer adoption of new or sustainable product lines in response to shifts in consumer preference or retailer mandates.
Working capital trends and cash flow stability, especially in periods of commodity price volatility or inventory build.
Disclaimer: This is research-only, informational analysis and not investment advice. It may include AI-generated interpretation and general industry context. Always verify important details using primary sources.

Comments