
Reynolds Consumer Products Strengthens Market Leadership with Balanced Branded and Private Label Portfolio Amid Cost Pressures
Q2 2026 results highlight sustained category dominance and ongoing innovation in household consumables despite raw material inflation challenges.
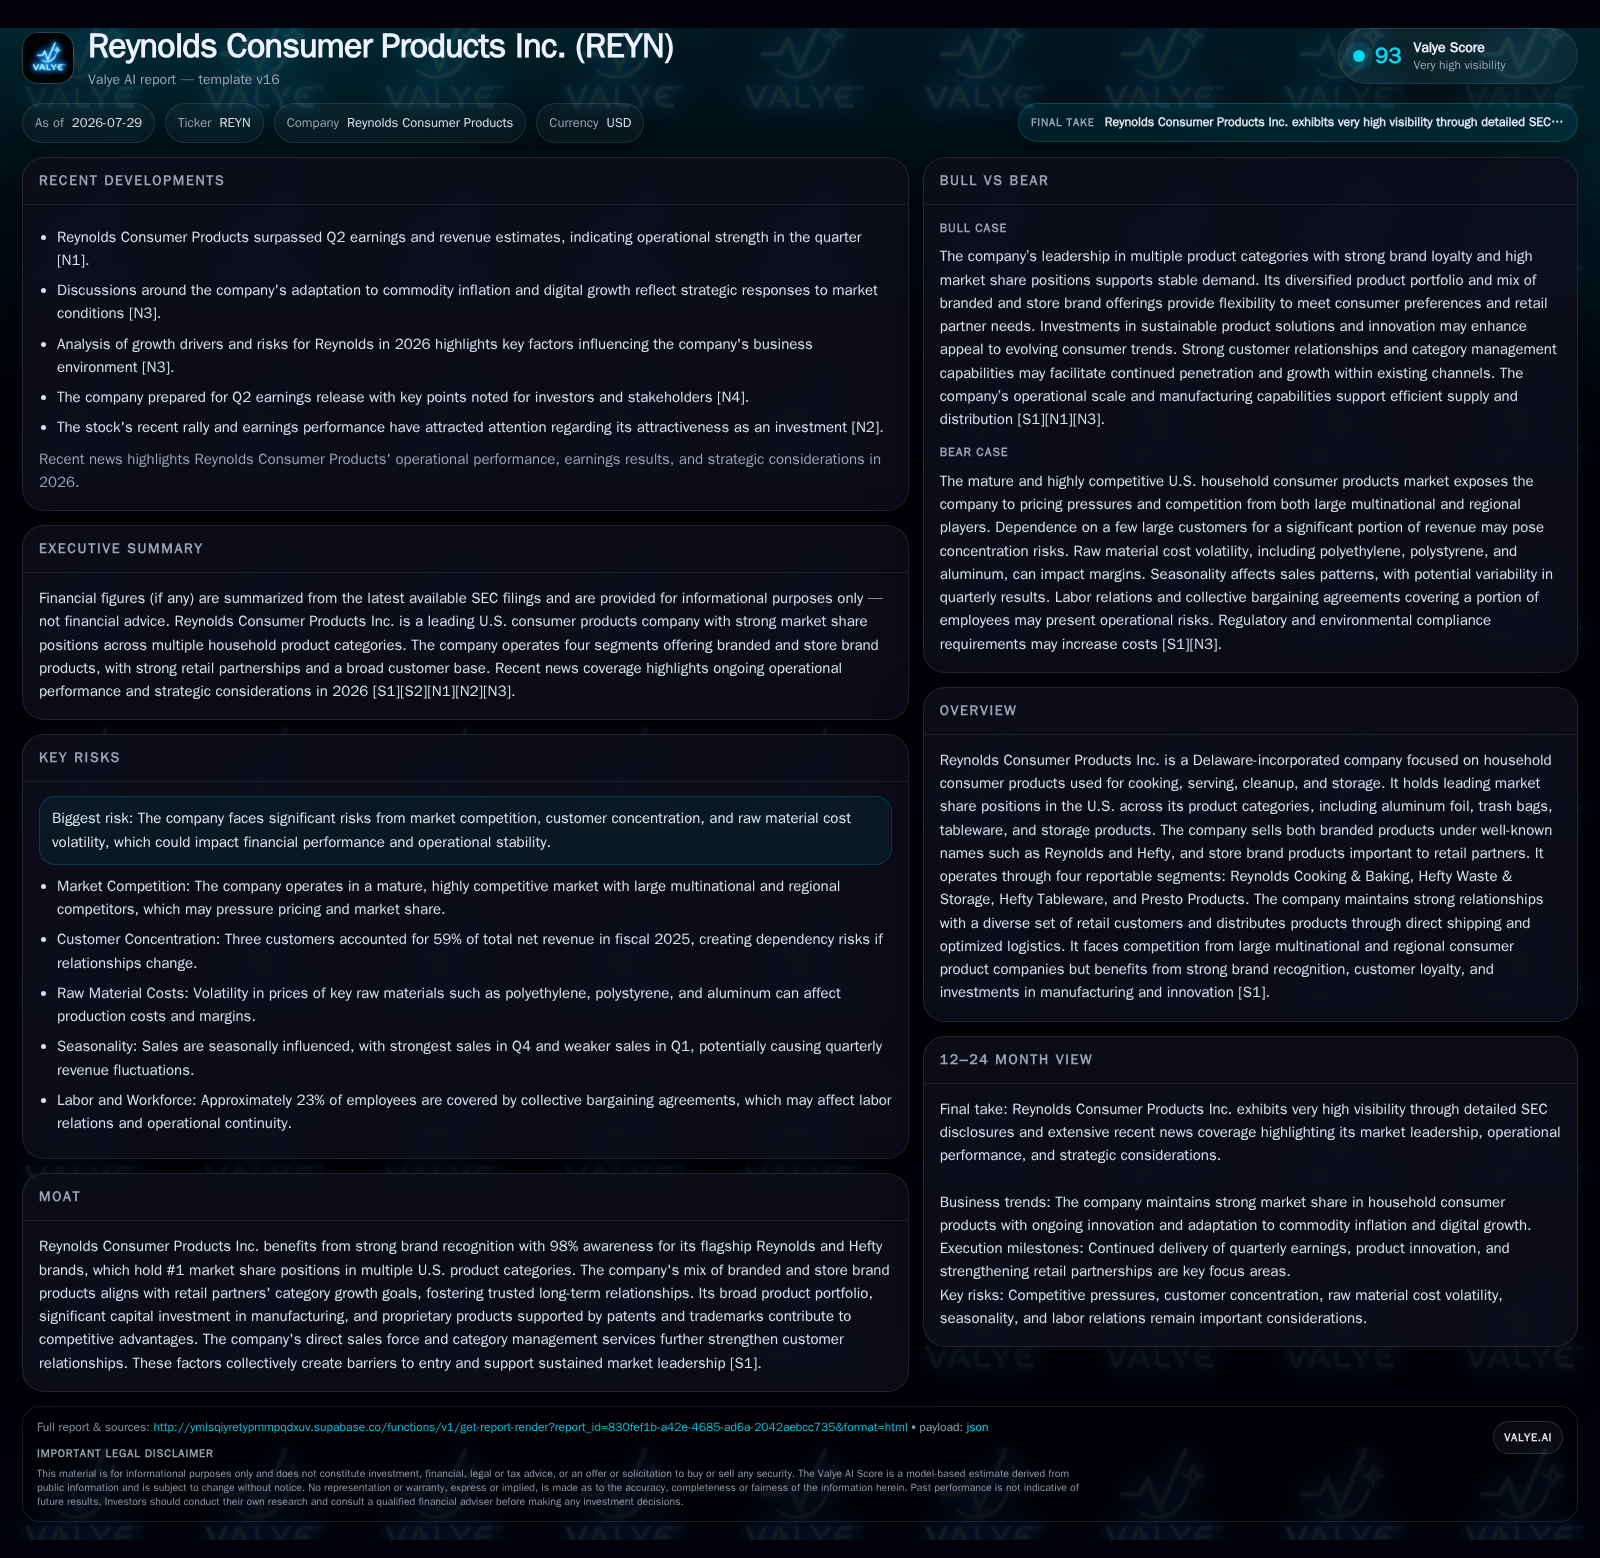
Reynolds Consumer Products Inc. reported a second quarter exceeding earnings and revenue expectations, reaffirming its strong market position across key product categories like aluminum foil, trash bags, and disposable tableware. The company’s dual focus on branded and private label products underpins robust retail partnerships and consumer loyalty, crucial in an industry characterized by frequent repurchases and low product differentiation. While raw material cost inflation continues to pressure margins, effective trade promotion management and supply chain optimization remain strategic levers. Financially, Reynolds maintains a stable liquidity profile with a current ratio near 1.8 and substantial operating cash flows supporting ongoing capital investments.
Recent Operating Update
Reynolds Consumer Products’ second quarter ended June 30, 2026, came in ahead of consensus expectations for both earnings and revenues. This performance underscores the company's resilience during ongoing macroeconomic pressures including commodity cost inflation and shifting consumer habits [S2][N1]. The Q2 release highlighted continued strength in branded product sales despite competitive private label dynamics, supported by successful trade promotions adjusted to evolving retail conditions.
The quarterly filing reiterated the company’s commitment to innovation and category management excellence across its four reportable segments: Reynolds Cooking & Baking; Hefty Waste & Storage; Hefty Tableware; and Presto Products [S2][S27]. Branded products remain central to Reynolds’ strategy but are complemented by growing store brand portfolios tailored through agreements with major retail partners.
Business Model Deep Dive
Reynolds functions primarily as a manufacturer, marketer, and distributor of household consumer products used for cooking, serving, cleanup, and storage within U.S. households—reaching approximately 95% penetration. Its product mix ranges from aluminum foil (flagship Reynolds Wrap) to trash bags (Hefty Ultra Strong), disposable tableware items (plates, cups), plastic wraps, parchment papers, oven bags, among others [S1].
Revenue arises predominantly from sales contracts with diverse retail customers including grocery stores, mass merchants like Walmart and Costco warehouse clubs, dollar stores, drug stores, home improvement centers, military outlets, and e-commerce platforms [S14]. Branded sales are typically governed by informal trading policies allowing flexibility in trade incentives while private label products operate under one-to-multi-year agreements providing more predictable volumes but thinner margins
Trade promotions represent a critical lever for volume generation but reduce net revenue since the costs are recorded as sales allowances reflecting discounts, display fees or coupons negotiated with retailers. These programs account for about 5% of net revenue annually but require complex accrual modeling given variable customer participation rates across categories [S1]. Effective management here is essential as it impacts both top-line sustainability and margin preservation.
Margins are further influenced by raw material inputs—polyethylene resins for bags/wraps, polystyrene for tableware items, aluminum for foils. Capital-intensive manufacturing operations necessitate balanced capacity utilization supported by ongoing capex exceeding $160 million annually to maintain equipment modernization and operational efficiency [F1][S19]
Industry Structure & Competitive Position
The household consumer products industry is typified by large multinational CPG players competing alongside regional manufacturers and retailers’ own private label brands. Brand equity remains paramount; Reynolds benefits from very high brand awareness levels—98% recognition for its core namesake brands—which supports premium positioning versus lower-cost alternatives [S1].
Reynolds holds either the #1 or #2 market share positions in most product categories it serves (e.g., U.S. consumer foil market led by Reynolds Wrap). Store brand penetration acts as a double-edged sword: while driving category growth alongside retail partners' private label strategies, it exerts pressure on overall pricing power. Few competitors match Reynolds' breadth across multiple complementary households aisles such as cooking/baking wraps paired with trash bags and reusable storage solutions—a portfolio breadth supporting scale advantages.
Key competitive advantages include proprietary patents/trademarks underpinning differentiated products; significant capital investment providing manufacturing scale; direct sales force managing national/regional/local accounts effectively; and integrated category management which facilitates close retailer collaboration on merchandising strategies across branded/private-label skews [S1][S14][S27]
Growth Drivers
Innovation aimed at delivering convenience features (ease-of-use packaging) alongside environmentally sustainable products form dual pillars of future growth initiatives. For example:
- Introduction of compostable disposable tableware targets shifting consumer preferences toward greener solutions.
- Enhanced resealable closure systems extend usage occasions in food storage products.
- Expansion of store brand partnerships leverages retailer incentive alignment for category expansion.
- Increasing penetration via e-commerce channels supports omnichannel distribution reach.
- Continuous improvements in supply chain efficiency contribute to faster inventory turns which optimize working capital dynamics.
Reynolds’ ability to launch new SKUs that resonate both with consumers’ evolving lifestyles and retailer shelf economics will be key indicators of sustainable organic growth over the medium term [S1][N4][N5]
Risks And Constraints
Several challenges merit close monitoring:
- Raw Material Inflation: Ongoing commodity price volatility remains the largest margin headwind. Centralized purchasing contracts provide some mitigation but cannot fully insulate against sudden spikes particularly in aluminum or resins.
- Customer Concentration: Top three customers accounted for about 59% of revenues in FY25 creating dependency risks if any major contract renegotiations occur or if their retail mix shifts abruptly toward competitor or alternative private labels [S14].
- Trade Promotion Uncertainty: Accruals for trade promotion expenses rely on historical patterns plus estimations that can be disrupted by changes in retailer promotional calendars or new product introduction dynamics.
- Regulatory Compliance: As many products are food-contact materials subject to stringent safety standards plus environmental packaging laws relating to recyclability claims or biodegradability assertions.
- Competition: Both large multinationals with broader CPG exposures as well as private label suppliers investing heavily pose continuous encroachment threats on shelf space and price points.
- Capital Intensity: Maintaining manufacturing agility requires substantial ongoing capex commitments exposing free cash flow during downturns.
What To Watch Next
Key execution gauges include:
- Quarterly updates on branded vs store brand revenue mix shifts indicating strategic traction or erosion.
- Trade promotion spend trends relative to sales growth revealing pricing power durability.
- New product launches especially those tied to sustainable packaging receiving retailer uptake signals.
- Retail customer concentration trend changes or announcements regarding long-term agreements.
- Commodity input cost trajectory combined with related impact on gross margins each quarter.
- Manufacturing capacity utilization data or disruptions potentially affecting supply availability.
- E-commerce channel contribution growth as digital sales increasingly influence total volume dynamics.
- Capital expenditures pace vs free cash flow generation benchmarks assessing financial flexibility going forward.
Regular assessment of these factors will clarify the sustainability of current profitability metrics against an evolving competitive backdrop.
Financial Profile Discussion
Overall financial position balances healthy cash conversion metrics against moderate leverage typical for capital-intensive branded consumer products manufacturers reliant on supplier agreements for raw materials.[F1][S15] Ongoing focus on free cash flow improvements through supply chain efficiency may enhance balance sheet flexibility to fund innovation or shareholder returns going forward.
This analysis synthesizes the latest SEC disclosures supplemented by recent earnings reports without offering investment advice. It aims to provide an informed perspective on Reynolds Consumer Products’ strategic posture within the household consumer products industry based solely on documented evidence.
Financial position in context
As of 2026-03-31, companyfacts shows $71mm in cash and equivalents and $1.53bn of total debt [F1]. The same snapshot implies net debt of roughly $1.46bn, keeping balance-sheet context relevant but secondary to the operating story [F1]. Current assets of $1.11bn and current liabilities of $616mm imply a current ratio near 1.79x for 2026-03-31 [F1].
Disclaimer: This is research-only, informational analysis and not investment advice. It may include AI-generated interpretation and general industry context. Always verify important details using primary sources.

Comments