
RLJ Lodging Trust: Focused Service, Brand Leverage, and the Next Phase of Hotel REIT Economics
RLJ Lodging Trust’s premium-branded, rooms-oriented hotel portfolio is showing operational momentum, but the company’s ability to sustain margin strength and value creation will hinge on asset management execution, capital recycling, and navigating intense competition and lodging cyclicality.
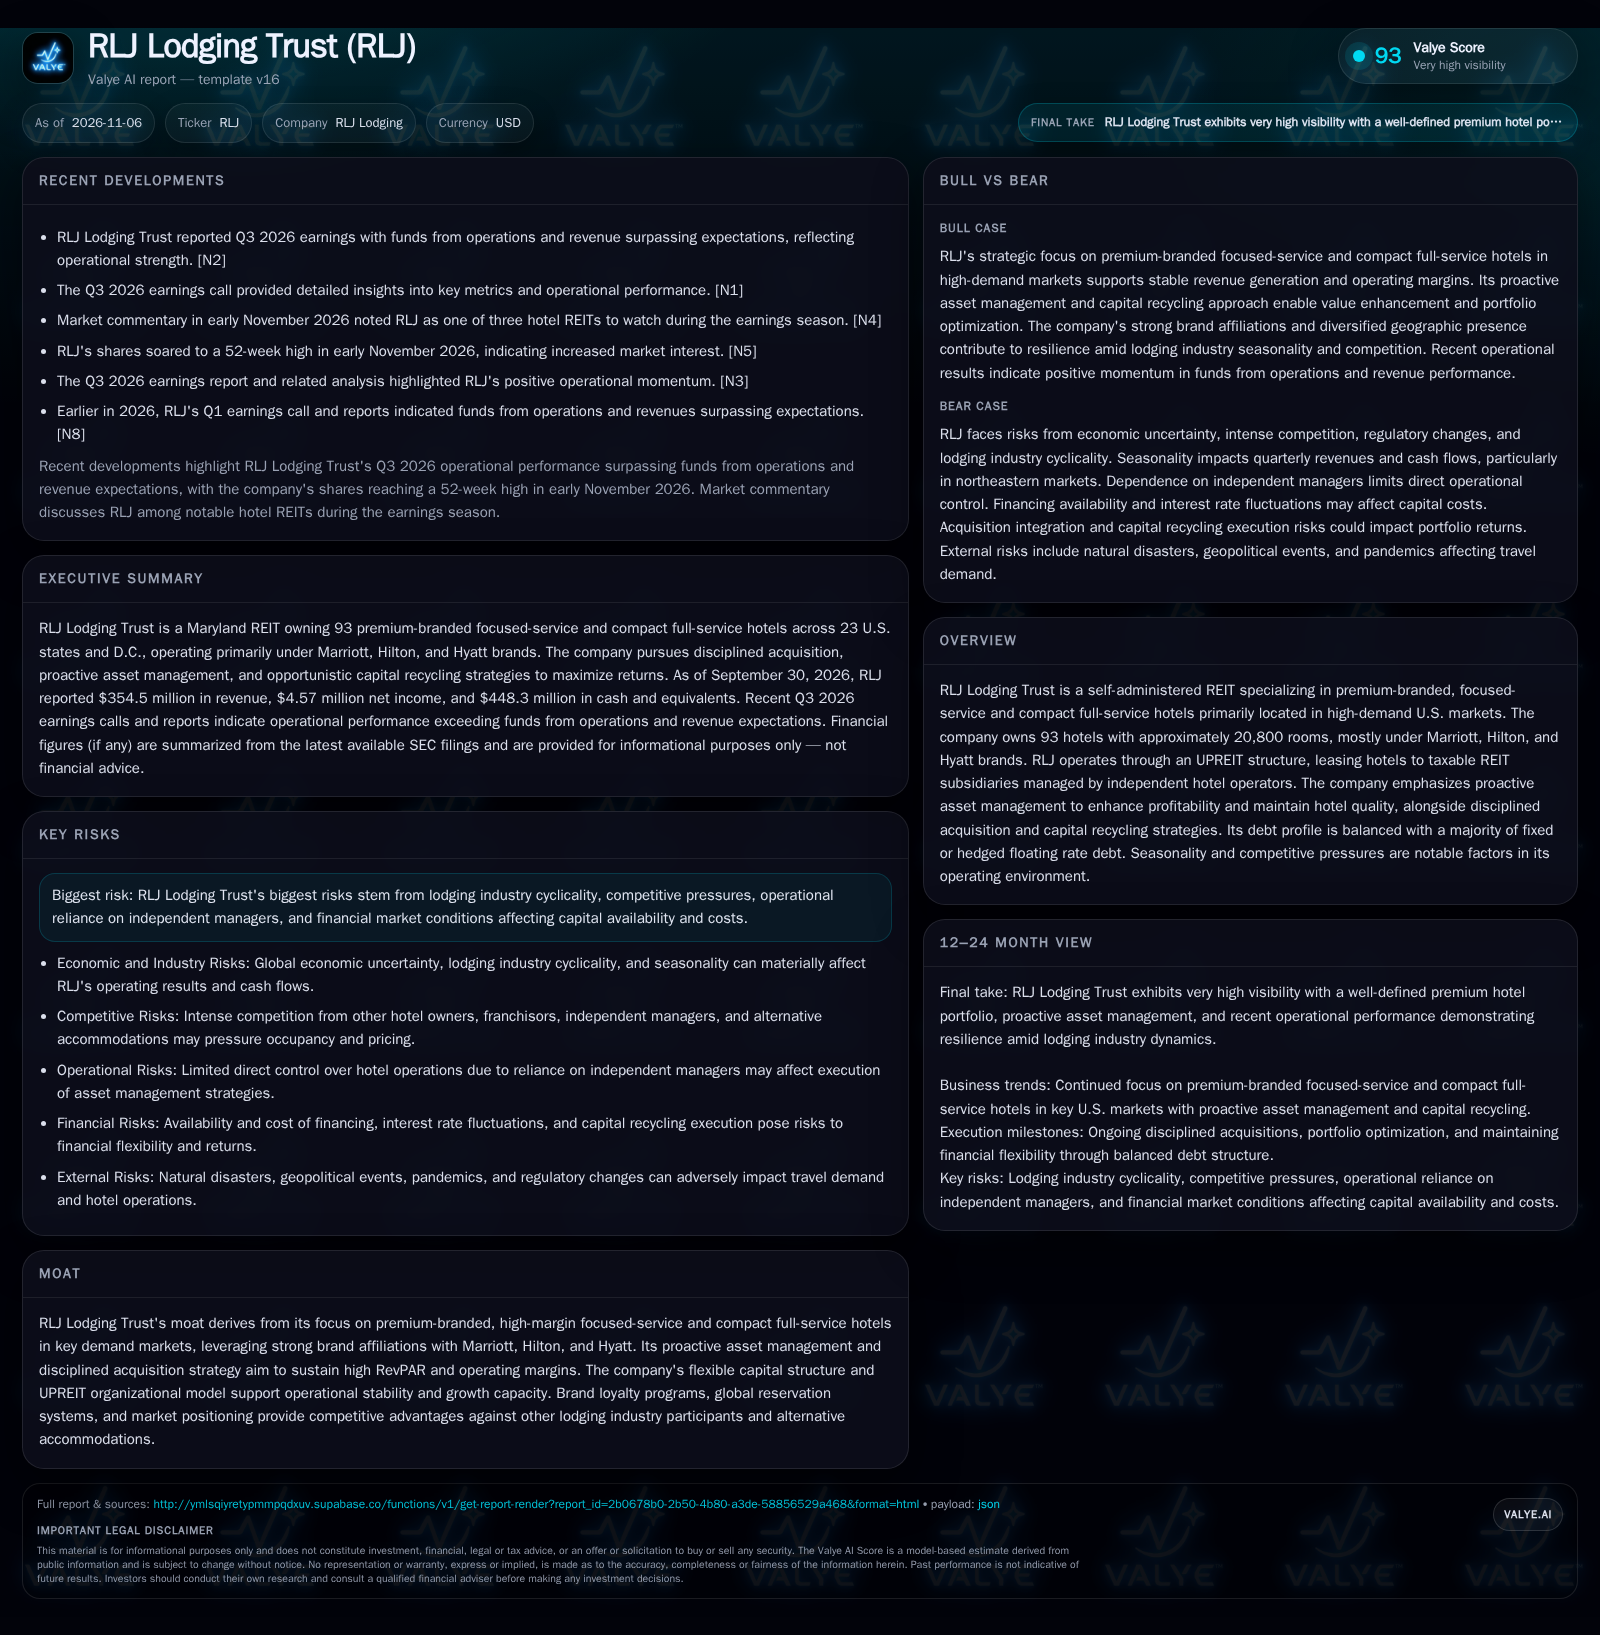
RLJ Lodging Trust exceeded Q3 2026 revenue and FFO expectations, reflecting operational momentum. The REIT’s portfolio of 93 primarily premium-branded, focused-service hotels is concentrated in high-demand U.S. markets, with nearly 90% under Marriott, Hilton, and Hyatt flags. Asset management, disciplined acquisitions, and capital recycling are core to RLJ’s strategy, but the company faces risks from industry cyclicality, competition, and limited direct operational control. The next phase will test RLJ’s ability to drive RevPAR growth and margin resilience amid evolving demand and capital market conditions. [S1] [S2] [N1] [N2] [N3]
RLJ Lodging Trust is riding a wave of operational strength, with Q3 2026 financials exceeding market expectations and its shares reaching a 52-week high. As one of the largest U.S. lodging REITs by owned hotels and rooms, RLJ’s model centers on premium-branded, focused-service properties in demand-rich markets. The company’s ability to sustain value creation will depend on how effectively it manages its portfolio, capitalizes on brand partnerships, and adapts to shifting travel trends and industry headwinds. The next chapter for RLJ will be defined by its execution on asset management and capital allocation as much as by external demand cycles. [S1] [S2] [N1] [N2] [N5]
Operational Outperformance and Portfolio Scale Set the Stage
RLJ Lodging Trust delivered $354.5 million in revenue and $4.57 million in net income for Q3 2026, with both funds from operations (FFO) and revenue surpassing analyst expectations. This operational strength was highlighted in recent earnings calls and market coverage, which also noted RLJ’s shares reaching a 52-week high in early November 2026. The REIT owns 93 hotel properties totaling roughly 20,800 rooms across 23 states and the District of Columbia, making it one of the largest publicly traded lodging REITs in the U.S. Nearly 90% of its hotels are affiliated with Marriott, Hilton, or Hyatt, underscoring the portfolio’s focus on premium, globally recognized brands. [S1] [S2] [N1] [N2] [N3] [N5]
These facts are significant because they reflect both current market confidence and the underlying scale and brand leverage of RLJ’s portfolio. Surpassing FFO and revenue estimates suggests effective asset management and resilience in demand, but the real test will be whether RLJ can sustain this momentum as lodging industry cycles evolve.
How RLJ Makes Money: Brand Premiums, Asset Leverage, and Margin Dynamics
RLJ’s core economics depend on maximizing revenue per available room (RevPAR) and operating margins across a portfolio of largely focused-service and compact full-service hotels. These property types typically offer higher margins than full-service hotels due to lower staffing needs, streamlined amenities, and a focus on transient and business travelers rather than group/convention business. The heavy concentration of Marriott, Hilton, and Hyatt brands may support stronger average daily rates (ADR) and occupancy, leveraging global loyalty programs and reservation systems.
RLJ’s hotels are leased to taxable REIT subsidiaries (TRSs), which then contract with independent hotel managers. This structure enables RLJ to maintain REIT tax status but limits direct operational control, making asset management and alignment with operators critical. Revenue growth may be driven primarily by rate increases, modest occupancy gains, and selective portfolio upgrades, while cost control is essential given the industry’s labor and utility cost exposure.
Capital allocation is central to RLJ’s economics. The company seeks to acquire hotels below replacement cost and selectively sell mature or non-core assets (capital recycling), aiming to redeploy capital into higher-return opportunities or renovations. The balance sheet is managed with a mix of unsecured and secured debt, mostly fixed or hedged, which helps manage interest-rate risk but may limit flexibility if credit conditions tighten. Significant capital needs arise from periodic renovations required by brand standards and competitive pressure.
Operating leverage is present, but modest relative to more asset-light models: incremental RevPAR growth can flow through to margins, but fixed costs (property taxes, insurance, maintenance) and the need for ongoing capex temper margin expansion in downturns.
Brand Affiliations and Asset Strategy in a Crowded Lodging Landscape
RLJ’s primary competitive advantages stem from its scale, focus on premium-branded properties, and concentration in high-demand U.S. markets. Brand affiliation with Marriott, Hilton, and Hyatt provides access to robust loyalty programs, global distribution, and quality standards that can support occupancy and pricing—especially valuable in periods of demand uncertainty. However, these same advantages are available to other well-capitalized lodging REITs and private equity-backed hotel owners.
Competition is fierce, not just from other branded hotels, but increasingly from alternative accommodations such as short-term rentals and boutique independents targeting the same urban and leisure travelers. The focused-service segment itself is crowded, with many institutional owners pursuing similar acquisition and management strategies.
RLJ’s asset management and capital recycling approach—buying below replacement cost, renovating, repositioning, or rebranding, and selling at value-maximizing moments—can create incremental value, but execution risk is high. The company’s reliance on independent operators means that alignment and performance monitoring are perpetual challenges, especially as labor costs, consumer preferences, and technology continue to evolve.
What Could Unlock RLJ’s Next Leg of Outperformance?
A favorable scenario for RLJ would see sustained strength in U.S. lodging demand, particularly in urban and business travel markets where its portfolio is concentrated. If RevPAR growth outpaces cost inflation—driven by brand power, effective revenue management, and successful property upgrades—operating margins could expand. Additional upside could come from accretive acquisitions at attractive valuations, successful renovations that boost property earnings, and well-timed asset sales that recycle capital into higher-growth assets.
Evidence that would support this scenario includes continued outperformance in FFO and revenue versus peer REITs, positive same-property RevPAR growth, higher margins despite industry wage and utility pressures, and successful execution of acquisitions or dispositions at favorable cap rates. Confirmation would also come from RLJ’s ability to maintain its premium brand mix and geographic diversification while expanding its portfolio or entering new high-growth markets.
Most Likely Outcome: Margin Management Amid Cyclical Fluctuations
The most plausible path is that RLJ maintains stable-to-moderate growth, with RevPAR and margins fluctuating in line with broader U.S. lodging trends. Seasonality will continue to drive quarterly volatility, especially for northeastern and Florida hotels. Competitive pricing pressure and rising labor costs may offset some benefits from brand affiliation and asset management, but RLJ’s disciplined acquisition and capital recycling should help preserve portfolio quality.
Evidence for this scenario would include revenue and FFO in line with sector averages, steady (but not expanding) margins, and periodic asset sales and acquisitions that keep the portfolio modern and competitive. A lack of meaningful RevPAR outperformance versus peers, or only modest gains in occupancy and ADR, would confirm a base case of steady but unspectacular returns.
Where RLJ’s Model Could Be Tested: Demand Shocks and Execution Risks
A negative scenario would be triggered by a downturn in travel demand due to macroeconomic weakness, geopolitical events, or a resurgence of pandemic-related disruptions. Under such conditions, occupancy and ADR could fall, compressing RevPAR and operating margins. High fixed costs and required renovations could pressure cash flow, while asset values might decline, making capital recycling less accretive or even loss-making.
Additional downside risks include missteps in acquisition integration, failed renovations, or deteriorating performance by third-party operators—any of which could erode returns and portfolio value. Evidence of this scenario would include missed FFO/revenue targets, negative same-property RevPAR, deteriorating margins, asset write-downs, or forced sales at unattractive prices.
Testing the RLJ Thesis: Portfolio Execution, Demand Cycles, and Brand Leverage
Trends in same-property RevPAR growth, especially relative to focused-service peer REITs, will help assess RLJ’s asset management effectiveness (if disclosed).
Operating margin trajectories—whether RLJ can expand or at least maintain margins in the face of rising costs—are a crucial test.
The pace, pricing, and accretiveness of acquisitions and asset sales, as well as any disclosed cap rates, will indicate success in capital recycling and portfolio optimization.
Brand mix stability and any shifts in the proportion of Marriott, Hilton, and Hyatt properties—changes could signal either opportunity or risk.
Updates on major renovation projects, rebranding efforts, or property upgrades—execution and return on investment will be central.
Occupancy and ADR trends in key markets, especially in the context of seasonality and demand shocks, would provide early warning of cyclical stress (if disclosed).
Management commentary on labor cost pressures, operational expenses, and alignment with independent hotel operators will reveal underlying margin dynamics.
Any changes to the company’s balance sheet structure or debt maturity ladder, particularly if refinancing risk or liquidity needs become more acute.
Disclaimer: This is research-only, informational analysis and not investment advice. It may include AI-generated interpretation and general industry context. Always verify important details using primary sources.

Comments