
Red Rock Resorts in 2026: Debt, Operational Leverage, and the Realities of Nevada Gaming Economics
Red Rock Resorts’ latest quarter exposes the tension between its asset-heavy model, persistent operational challenges, and the capital structure realities of a Nevada-centric gaming portfolio. With a net loss in Q3 2026 despite nearly $489 million in revenue, and a current ratio below 1.0, the company faces a need for operational improvement or portfolio adjustment to sustain long-term value for shareholders.
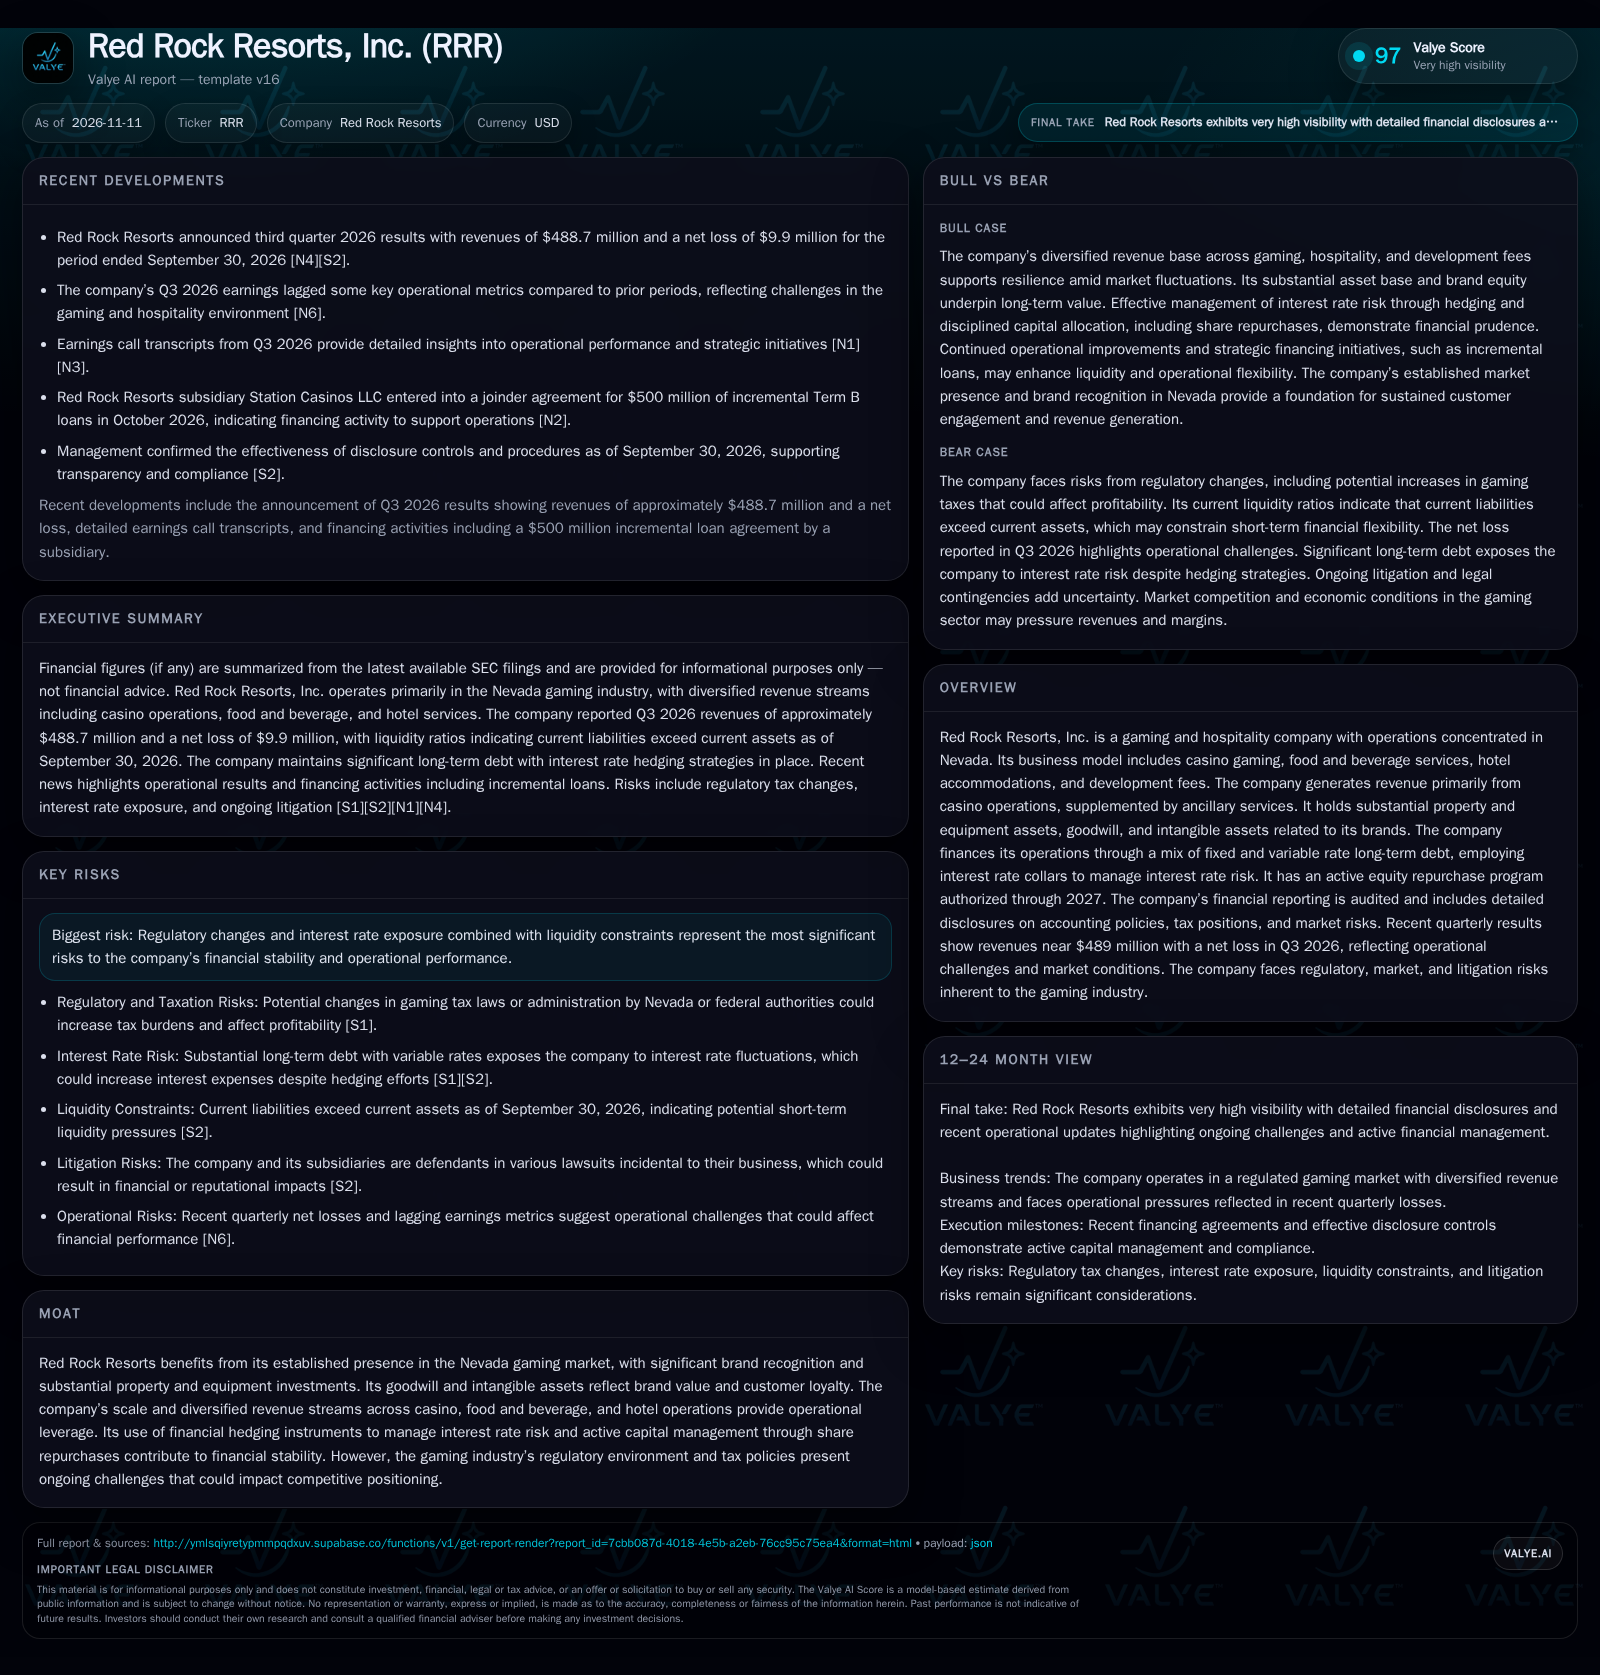
Red Rock Resorts reported Q3 2026 revenue of $488.7 million and a net loss of $9.9 million, with current liabilities exceeding current assets and a substantial long-term debt load. The company’s business model relies on diversified gaming and hospitality revenue streams in Nevada, but faces near-term pressure from operational underperformance and capital structure constraints. Ongoing regulatory, interest rate, and litigation risks highlight the importance of execution and balance sheet management going forward. [S2] [N4] [N6]
Red Rock Resorts, Inc. is at a crossroads in late 2026. Despite generating nearly half a billion dollars in quarterly revenue from its casino, hospitality, and development operations concentrated in Nevada, the company reported a net loss and faces a balance sheet where current liabilities outstrip current assets. With operational results lagging expectations and a sizable long-term debt load, Red Rock’s future will hinge on its ability to improve operating leverage, manage regulatory and financial headwinds, and deploy capital strategically. The coming quarters will test whether its Nevada-focused asset strategy can weather rising costs and sector volatility—or whether further portfolio or financial restructuring will be necessary.
Quarterly Losses and Liquidity Imbalance: The Immediate Financial Picture
Red Rock Resorts reported $488.7 million in revenue for Q3 2026 but posted a net loss of $9.9 million, with both basic and diluted EPS at -$0.17 per share. Current assets stood at $286.0 million against current liabilities of $338.8 million as of September 30, 2026, resulting in a current ratio of 0.84 and a cash ratio of 0.38. The company continues to carry substantial long-term debt at weighted average interest rates of 5.6%–6.0%. The company reported cash and liquidity metrics for the period; these figures do not by themselves establish operating runway, investment capacity, financial flexibility, or financing capacity. [S2] [N4] [N6]
How Red Rock Resorts Monetizes Nevada Gaming and Hospitality
Red Rock Resorts’ core business model is built around casino operations, which generate the majority of revenue through gaming activities, supplemented by food and beverage, hotel accommodations, and development fees. The company’s cost structure is characterized by high fixed costs—property, labor, and regulatory compliance—relative to variable costs, creating significant operating leverage. When gaming volumes are robust, incremental revenue can flow through to the bottom line at attractive margins, but downturns or cost inflation can quickly erode profitability.
The capital intensity of the business is high: physical assets, goodwill, and intangible assets are substantial, reflecting the property-centric nature of regional gaming. The company’s substantial long-term debt adds to fixed obligations, with interest expense sensitive to rate fluctuations. Interest rate collars partially hedge variable-rate exposure, but rising rates could still incrementally pressure cash flow.
Defending Share and Margins in a Crowded Nevada Gaming Market
Red Rock’s competitive positioning is rooted in its established brand, geographic concentration, and property scale in Nevada. Its properties cater to both local and regional customers, which can provide some insulation from international travel swings but also exposes the business to local economic cycles and demographic trends.
The Nevada gaming sector is highly competitive, with peer operators ranging from large integrated resorts to smaller, niche casinos. While Red Rock’s diversified revenue streams and property investments provide some differentiation, the company competes on service, amenities, and player loyalty programs. There is little evidence of structural switching costs or network effects in the regional gaming segment—customers can and do migrate between operators based on promotions, experience, or convenience.
Broader competitive threats include the expansion of online gaming, the potential entry of new physical or digital competitors in Nevada or adjacent markets, and technology-driven shifts in gaming preferences. Regulatory changes—such as increases in gaming taxes or new compliance costs—could further compress margins and erode competitive advantages.
Unlocking Value: What a Recovery in Operating Leverage Could Deliver
A favorable scenario for Red Rock Resorts would see a rebound in gaming volumes, improved cost control, and the successful leveraging of its fixed asset base to restore positive operating leverage. This could be driven by a combination of local economic strength, effective marketing to drive visitation, and disciplined management of labor and non-gaming expenses.
If Red Rock is able to expand margins through higher occupancy, increased gaming spend per visitor, or improved food and beverage profitability, incremental revenue would likely have an outsized impact on net income given the high fixed-cost structure. Evidence for this scenario would include a return to positive net income, sequential improvement in EBITDA margins, and growing free cash flow. Additional confirmation would come from resumed or accelerated share repurchases, signaling management confidence and surplus cash generation. Conversely, continued net losses or stagnant revenue would falsify this recovery thesis.
Operating Under Pressure: Navigating a Flat-to-Modest Recovery
The most plausible near-term outlook is that Red Rock Resorts operates in a persistently challenging environment, with modest revenue growth offset by cost pressures and elevated interest expense. The company may be able to maintain stable revenue from its core Nevada properties, but margin expansion could be limited by rising labor, regulatory, and capital costs.
In this scenario, operational improvements are incremental: management focuses on expense discipline, targeted capital spending, and selective marketing to defend local market share. Debt service remains a meaningful drag on free cash flow, and liquidity ratios stay below optimal levels. Share buybacks proceed cautiously, if at all, constrained by available cash and covenant considerations. This base case would be confirmed by stable but unimproved profitability, muted capital returns, and no major portfolio transactions. Evidence of accelerating losses, deteriorating liquidity, or substantial asset sales would suggest downside risk.
What Happens if Regulatory, Cost, or Demand Shocks Hit Simultaneously?
A negative scenario for Red Rock Resorts could unfold if adverse regulatory changes—such as higher gaming taxes or compliance costs—combine with rising interest rates and continued operational underperformance. In this event, the company faces both margin compression and increased debt service, with limited ability to offset these pressures through pricing or volume growth.
Liquidity could come under acute stress if net losses persist and current liabilities further outpace current assets. In a severe case, Red Rock might be forced to curtail capital expenditures, suspend share repurchases, or consider asset sales to preserve cash. Legal or litigation setbacks could add to the burden. Confirmation of this scenario would include sustained negative cash flow, covenant breaches, or public discussion of restructuring options. Any improvement in liquidity or a sudden rebound in demand would challenge this outcome.
How to Track Red Rock Resorts’ Progress: Operational and Financial Markers to Test the Thesis
Quarterly net income or loss trends—sustained improvement or further deterioration in bottom-line profitability would indicate whether operational leverage is working in Red Rock’s favor. [S2] [N4] [N6]
Sequential and year-over-year changes in EBITDA margin—if disclosed—to assess the impact of revenue and cost management on core profitability.
Updates on share repurchase activity—actual buybacks versus authorized capacity would reveal management’s confidence and cash priorities. [S2]
Disclosures of regulatory or tax changes affecting gaming operations in Nevada—potential margin impact and compliance cost effects.
Interest expense and debt maturity profile—especially in the context of interest rate changes and refinancing activity. [S1]
Material litigation developments—if disclosed, resolution or escalation of legal risks that could affect financial results.
Disclaimer: This is research-only, informational analysis and not investment advice. It may include AI-generated interpretation and general industry context. Always verify important details using primary sources.

Comments