
Ryerson Holding Corp: Scale, Liquidity Structure, and Profitability Sustainability
Ryerson Holding Corp posts multi-billion dollar annual revenues and positive Q3 2026 earnings, but recent widened losses and a reported cash ratio highlight ongoing volatility and liquidity management questions. The company’s operational scale is clear, yet its competitive positioning and margin resilience remain opaque.
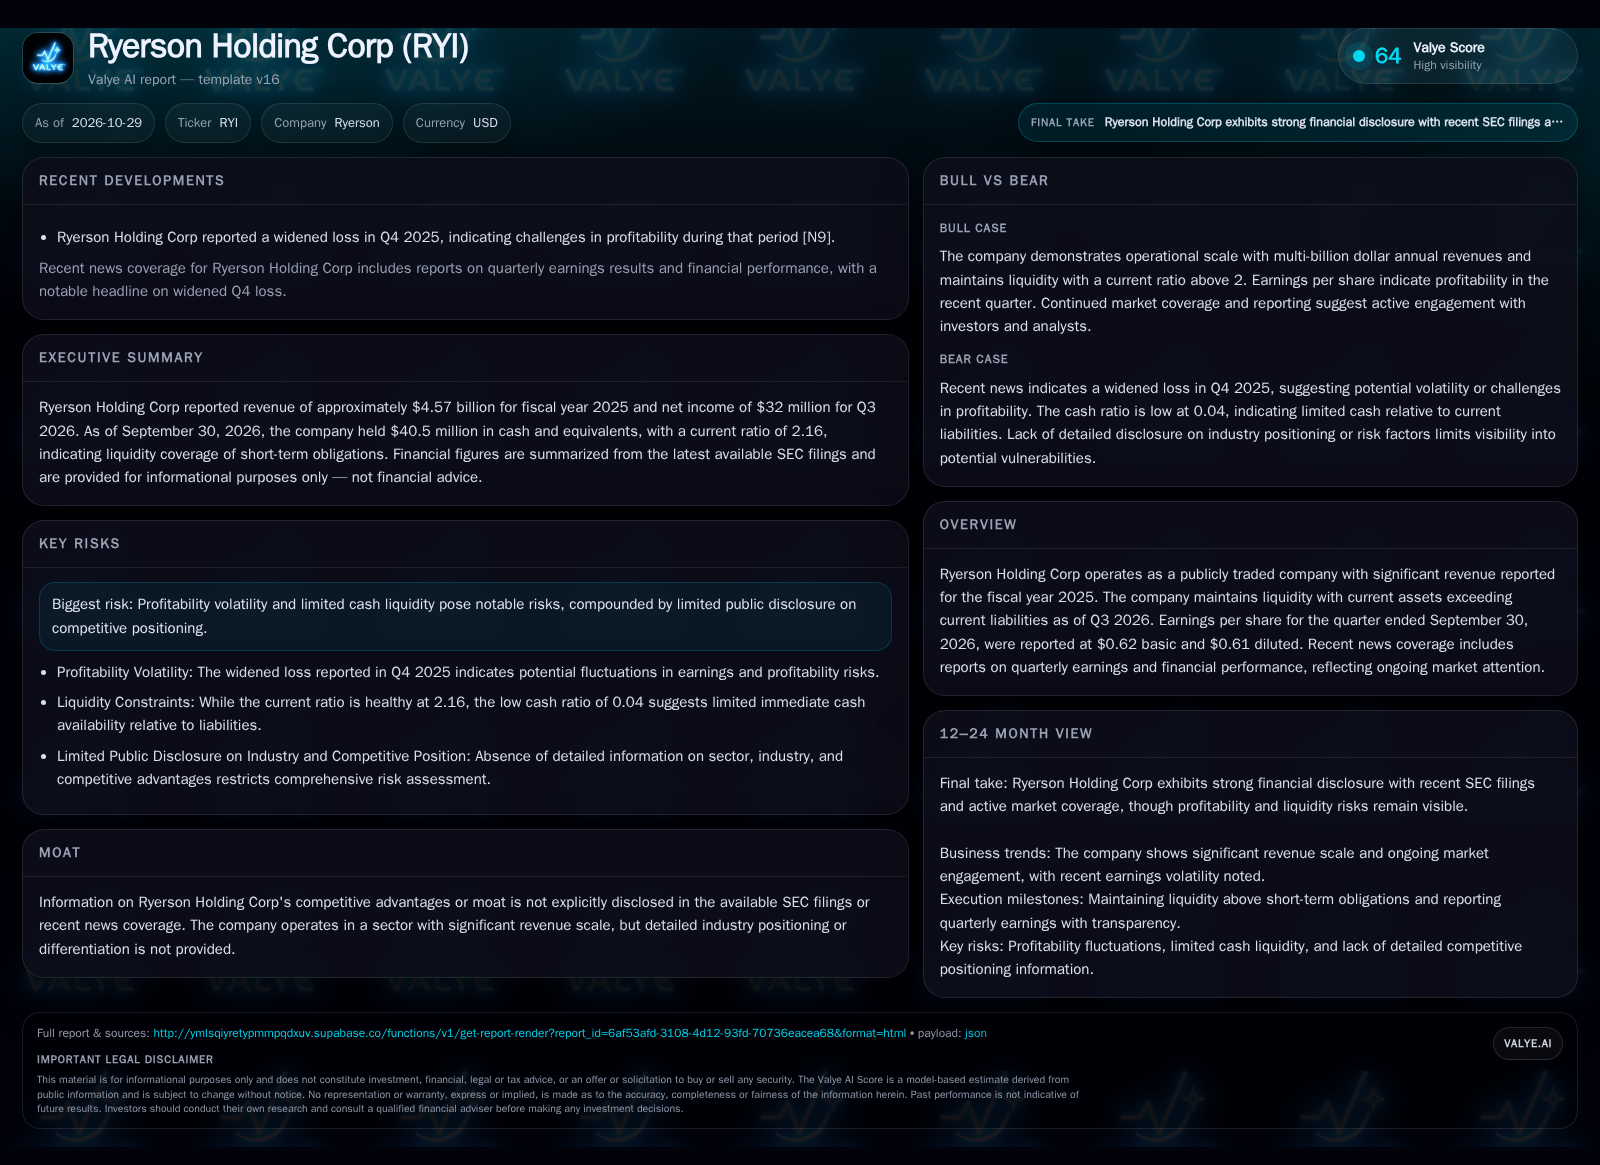
Ryerson Holding Corp reported $4.57 billion in 2025 revenue and $32 million in net income for Q3 2026, maintaining a current ratio of 2.16 but with a reported cash ratio of 0.04. Absent detailed competitive disclosures, Ryerson’s ability to defend margins and sustain earnings will hinge on its cost discipline and industry dynamics [S1] [S2].
Ryerson Holding Corp stands out for its operational scale, reporting over $4.5 billion in 2025 revenue and maintaining positive net income in the latest quarter.Yet, beneath these headline figures, the company contends with earnings volatility and a notably reported cash ratio, pointing to tight liquidity management. With limited public disclosure on its market position or competitive differentiation, Ryerson’s future trajectory will likely hinge on its ability to balance cost control, working capital discipline, and resilience to industry cyclicality.
Recent Results Reflect Scale and Financial Strains
Ryerson Holding Corp reported $4.5713 billion in revenue for fiscal year 2025, demonstrating significant operational scale in its sector [S1]. For the quarter ending September 30, 2026, the company posted $32 million in net income and basic earnings per share of $0.62, indicating a return to quarterly profitability [S2]. However, news coverage notes that Ryerson’s Q4 2025 loss widened, suggesting periods of notable earnings volatility. As of Q3 2026, Ryerson reported liquidity-ratio trends of 2.16, with current assets of $2.4673 billion against current liabilities of $1.1435 billion, but its cash and equivalents stood at only $40.5 million, resulting in a cash ratio of 0.04 [S2]. These facts point to an enterprise with robust scale and working capital coverage, but with immediate liquidity constraints and a track record of profit swings.
How Revenue Scale, Margins, and Working Capital Interact
Ryerson’s multi-billion-dollar revenue base suggests participation in a high-volume, low-margin segment—likely metal distribution, processing, or industrial supply, given historical business model patterns for companies of this profile. These businesses typically earn modest gross margins and rely on operational efficiency, inventory management, and disciplined purchasing to generate profits. Revenue is driven by a combination of pricing (often linked to commodity inputs), sales volume to industrial and manufacturing customers, and the mix of value-added processing services.
This structure can amplify both upside and downside: strong periods may convert inventory to cash, while downturns may pressure liquidity if receivables stretch or inventory values fall. Capital needs are likely moderate and recurring, focused on inventory replenishment, credit lines, and periodic facility or equipment upgrades rather than major capex.
Given Ryerson's likely exposure to commodity price fluctuations, the company’s margin stability is inherently linked to its ability to manage input cost volatility and pricing power. If commodity prices experience sustained increases, Ryerson’s capacity to pass these costs onto customers without significant volume loss becomes critical. Conversely, in a declining price environment, inventory valuation methods and timing can materially impact reported margins and working capital. The interplay between procurement strategies, contract terms with suppliers, and customer pricing agreements will therefore be pivotal in cushioning earnings against commodity swings. Furthermore, the company’s working capital intensity—particularly inventory holding periods and receivables collection—directly affects liquidity and financing needs, necessitating a finely tuned balance between operational scale and cash flow management.
Fragmented Market Conditions Cloud Ryerson’s Competitive Edge
No explicit disclosures exist regarding Ryerson’s competitive advantages or industry positioning. In the industrial distribution and metals supply sector, competitors typically include both national distributors and regional specialists, as well as direct mill suppliers for larger customers. Competitive intensity is driven by price, service reliability, breadth of product offerings, and logistics capabilities. Switching costs for customers are generally low unless differentiated value-added services or integration with customer supply chains are present.
Without evidence of a proprietary offering or significant cost advantage, Ryerson’s margins may be vulnerable to price-based competition and customer churn. Industry fragmentation and commodity input volatility further limit pricing power. The company’s scale could confer some purchasing leverage and logistical efficiency, but in the absence of disclosed moats or unique technology, Ryerson’s competitive position appears exposed to the sector’s typical margin compression and business-cycle risks.
In a fragmented and competitive industrial distribution market, scale alone may not guarantee sustainable advantages. Ryerson’s ability to leverage its size for better supplier terms or logistics efficiencies depends on the depth of its supplier relationships and the sophistication of its supply chain management. Additionally, differentiation through value-added services—such as processing capabilities, just-in-time delivery, or integrated inventory management—could increase switching costs and customer loyalty, mitigating margin erosion. However, without clear evidence of such differentiation, the company remains vulnerable to commoditized competition where price sensitivity dominates. The presence of regional specialists and direct mill suppliers further intensifies competitive pressures, potentially limiting Ryerson’s pricing flexibility and exposing it to cyclical demand shifts.
Earnings Growth Through Margin Improvement and Working Capital Efficiency
A favorable scenario for Ryerson would see stabilization or improvement in end-market demand, allowing the company to leverage its scale for improved purchasing terms and more efficient inventory turns. If commodity prices stabilize or rise and Ryerson successfully passes through price increases while maintaining or expanding gross margins, earnings could recover meaningfully.
Evidence that would confirm this scenario includes sustained sequential growth in net income, rising gross margins, and a meaningful increase in cash and equivalents relative to current liabilities. Additional disclosures on customer retention, value-added service adoption, or differentiated supply-chain partnerships would strengthen the case for durable margin improvement.
If Ryerson can enhance operational efficiencies alongside margin improvements, the company may unlock incremental earnings growth beyond cyclical recovery. This would require disciplined cost control measures, including optimizing procurement, reducing overhead, and improving labor productivity. Additionally, working capital efficiency gains—such as faster inventory turnover and tighter receivables management—would free up cash flow to support reinvestment or debt reduction. In such a scenario, Ryerson’s scale could be a platform for negotiating better financing terms or pursuing selective capital investments that bolster competitive positioning. The realization of these improvements would hinge on stable or improving end-market conditions, enabling the company to execute its operational initiatives without undue pressure from declining volumes or intensifying price competition.
Incremental Gains Backed by Volume Stability and Cost Discipline
The most plausible near-term trajectory for Ryerson involves maintaining stable revenue and modest profitability as management navigates commodity cycles and competitive pricing pressure. Incremental improvements in operating efficiency, inventory management, and customer service could offset some margin compression, but structural gains may be limited absent a clear differentiation strategy.
This scenario would be confirmed by continued quarterly profitability, a reported liquidity-ratio trends, and minimal further deterioration in the cash ratio. Modest improvements in working capital turnover and evidence of disciplined expense management would support the view that Ryerson can manage through industry swings without significant financial distress.
Liquidity Vulnerabilities Surface with Commodity or Credit Shocks
A sharp decline in steel or metals prices, or a demand contraction among industrial customers, could trigger inventory write-downs, slower receivable collections, and compressed margins—potentially pushing the company into further losses.
If external financing becomes more expensive or less available, Ryerson could struggle to convert non-cash current assets to cash, raising the risk of liquidity stress.
Factors Influencing Ryerson’s Margin and Liquidity Strength
Quarterly trends in net income and gross margin, which would clarify whether recent earnings volatility is stabilizing or worsening.
Disclosure of working capital turnover rates—specifically, days sales outstanding and inventory days—if published, to assess liquidity conversion.
Changes in the cash ratio and absolute cash and equivalents, especially in the context of seasonal or cyclical swings.
Any commentary on customer retention, contract renewals, or value-added service penetration, which would suggest differentiation or switching friction.
Evidence of changes in credit facility usage, debt covenants, or refinancing activity, providing insight into external funding reliance.
Updates on capital expenditures or major facility investments, which could signal growth ambitions or required maintenance.
Disclosures around input cost trends and the company’s ability to pass through price increases to customers.
Disclaimer: This is research-only, informational analysis and not investment advice. It may include AI-generated interpretation and general industry context. Always verify important details using primary sources.

Comments