
SPAR Group Refocuses on North America: Navigating Liquidity Pressures and Revenue Headwinds
The challenge now is whether core service breadth, technology adoption, and operational focus can offset competitive and structural headwinds.
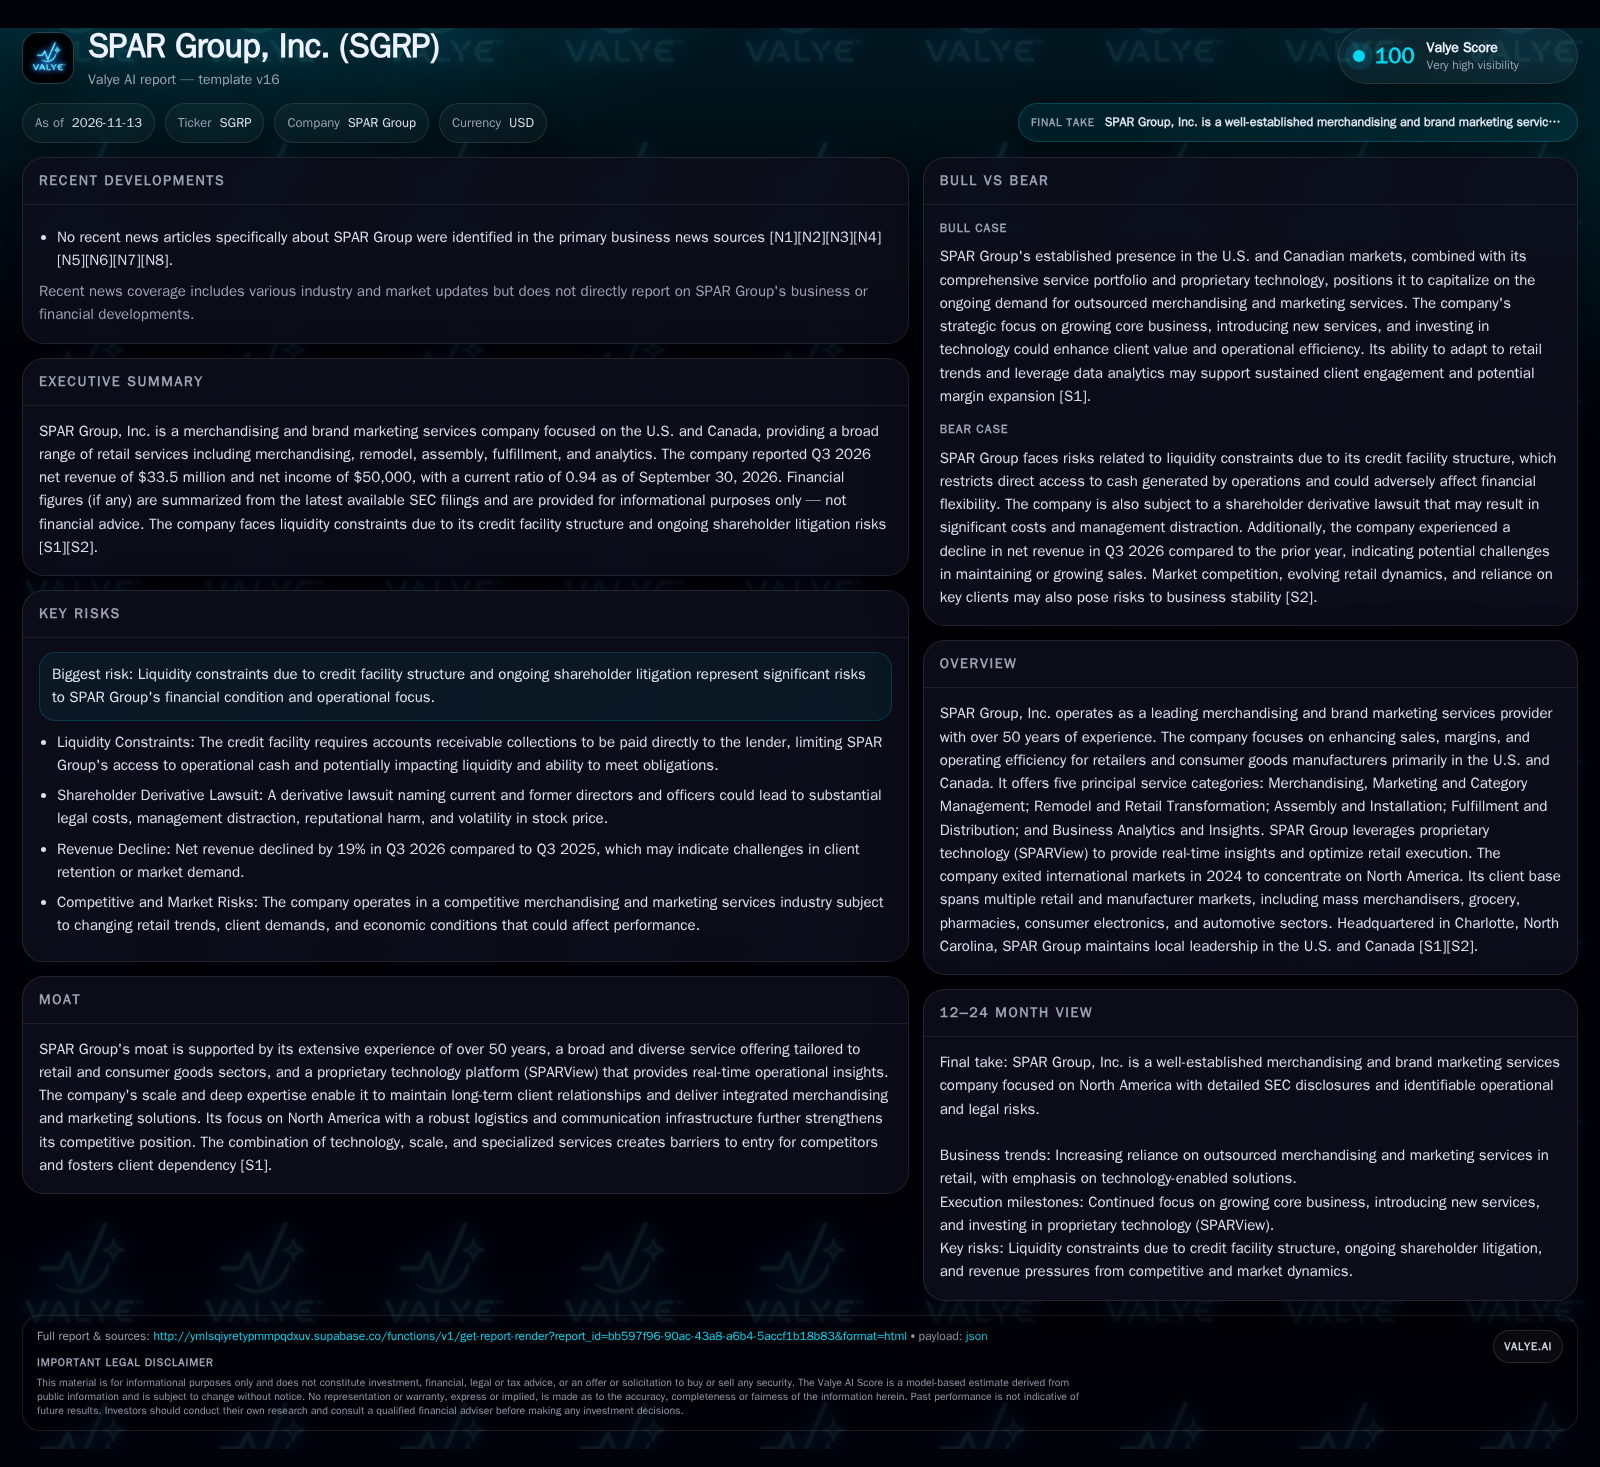
SPAR Group, Inc. is a merchandising and brand marketing services provider now concentrated in the U.S. and Canada, following an exit from several international markets in 2024. In Q3 2026, the company reported a 19% year-over-year revenue decline, a slim net income, and a current ratio below 1. Whether SPAR Group’s technology investments and focused service offerings can stabilize or grow the business remains a central question. [S1] [S2]
SPAR Group, Inc. has pivoted sharply toward its North American core after withdrawing from several international markets in 2024. The question for SPAR Group is whether its broad service portfolio, proprietary technology, and depth in merchandising and retail support can overcome intensifying competition and structural industry changes, or whether financial and operational constraints will limit its ability to adapt and grow.
Recent Financial Results and Strategic Refocusing Define SPAR Group’s Operating Reality
SPAR Group reported net revenue of $33.5 million for Q3 2026, a 19% decline from the prior year, with gross profit also falling by 17.7% year-over-year. Net income for the quarter was marginal at $50,000, and both basic and diluted EPS were $0.00. The company’s balance sheet showed cash and cash equivalents of $4.7 million as of September 30, 2026, with a current ratio of 0.94 and a cash ratio of 0.1, underscoring a tight liquidity position. A restrictive credit facility structure requires nearly all accounts receivable collections to be paid directly to the lender, limiting SPAR Group’s access to cash generated from operations. The company also faces ongoing shareholder derivative litigation involving current and former directors and officers, which could lead to significant legal costs and management distraction. In 2024, SPAR Group exited operations in Mexico, Brazil, South Africa, China, Japan, and India, now focusing exclusively on the U.S. and Canada. [S1] [S2]
How SPAR Group’s Service Model Interacts with Retailer Economics and Capital Demands
SPAR Group generates revenue by providing a menu of outsourced services—merchandising, remodel and transformation, assembly and installation, fulfillment, and business analytics—to retailers and consumer goods manufacturers. The company’s value proposition is rooted in helping clients optimize sales, margins, and operational efficiency, often through labor-intensive and logistics-driven projects. Pricing in this sector is typically contract-based, with a mix of project fees and ongoing service retainers, but margins are generally thin due to heavy wage costs, travel/logistics outlays, and competitive pricing pressure.
The company’s proprietary SPARView technology may enable differentiated analytics, real-time reporting, and operational visibility, which could support premium pricing or more defensible client relationships if clients perceive tangible value. However, the labor-centric nature of services means that fixed costs are relatively low, while variable costs track closely with project volume—limiting operating leverage unless technology or process improvements can reduce per-project labor intensity.
SPAR Group’s capital needs are moderate compared to asset-heavy industries, but cash flow is highly sensitive to working capital cycles. The structure of its credit facility, which redirects receivables to the lender, suggests a reliance on external liquidity and highlights vulnerability to any interruption in collections or increases in working capital requirements. Technology investment (such as SPARView) is a potential lever for margin improvement, but its impact will depend on adoption, client willingness to pay, and the ability to scale analytics across the service base.
Service Breadth, Technology, and Geographic Focus: Competitive Levers and Limitations
SPAR Group’s competitive position is built on a wide service offering, proprietary operational technology, and a long-standing presence in North American retail. Its 50-year history and established relationships can foster client trust and repeat business, particularly with national or multi-site retailers seeking reliable execution across geographies. The SPARView platform could act as a differentiator if it delivers actionable insights and measurable performance improvements for clients.
However, the merchandising and retail services sector is highly fragmented, with competition from both large integrated service providers and specialized local/regional firms. Barriers to entry are moderate: while technology, logistics reach, and relationship depth matter, new entrants can chip away at share via lower pricing or niche specialization. The company’s recent geographic retrenchment may reduce complexity and focus resources, but it also constrains growth potential to the more competitive North American market.
Potential technology-driven substitutes, such as automated shelf monitoring or in-store robotics, are not yet widespread but could erode traditional merchandising demand over time. Retailer insourcing—where large chains build internal capabilities—remains a persistent threat, especially if cost pressures or strategic priorities shift. The key test for SPAR Group will be whether its platform, process know-how, and service breadth can deliver a compelling value proposition versus both traditional competitors and emerging alternatives.
If Technology Integration and Service Expansion Drive Client Retention and Margin Recovery
A favorable outcome for SPAR Group hinges on its ability to leverage SPARView and its broad service suite to deepen client relationships and command premium pricing. If the company can demonstrate that its analytics and real-time visibility translate into measurable sales lifts or operational efficiencies for clients, it could boost retention, win new contracts, and potentially expand into higher-value advisory or data-driven services.
Expansion into adjacent services—such as supply chain optimization, omnichannel fulfillment, or advanced analytics—may provide incremental growth and margin opportunities. Successful execution would likely be confirmed by stabilization or growth in revenue, a rebound in gross margins, and evidence of new or expanded multi-year client engagements. Signs that clients are adopting higher-value analytics offerings and that technology is reducing per-project costs would further support the upside case.
The scenario would be falsified if technology investments fail to convert into client wins or margin improvement, or if the company is unable to stem revenue declines despite increased focus and investment.
Operational Focus Delivers Stability but Growth Proves Elusive Amid Margin Pressure
The most plausible middle-ground scenario is that SPAR Group maintains its current client base and stabilizes revenue following the international retrenchment, but faces ongoing margin pressure from competitive pricing and rising labor costs. Technology investments enable some operational efficiencies and client stickiness, but are not sufficient to drive material margin expansion or outsized growth.
In this scenario, the company’s financials reflect modest profitability, with net income remaining slim and liquidity constraints persisting due to the credit facility’s restrictive structure. Legal costs from ongoing litigation consume management attention and resources, further limiting the ability to invest in transformative initiatives. Evidence for this scenario would include flat or slightly declining revenues, gross margins that remain compressed, and limited improvement in cash flow or balance sheet strength.
This outcome would be challenged if SPAR Group wins significant new contracts, achieves higher adoption of its analytics platform, or demonstrates a clear upward trend in profitability and liquidity.
Liquidity Constraints and Revenue Erosion Lead to Strategic Vulnerability
An adverse scenario develops if SPAR Group’s revenue continues to decline due to client losses, intensified competition, or shifts in retailer outsourcing preferences. The company’s tight liquidity, compounded by a credit facility that restricts access to cash, could force cost-cutting, reduce service quality, or limit investment in technology and growth initiatives.
If the shareholder litigation results in substantial legal costs or unfavorable judgments, management distraction and reputational harm could accelerate client attrition or impair new business development. In a worst-case, persistent negative cash flow may lead to covenant breaches, restructuring, or the need for dilutive capital raises.
Confirmation of this scenario would come from continued top-line contraction, further deterioration in gross profit, worsening liquidity ratios, and escalating legal expenses. The downside could be mitigated if the company manages to renegotiate credit terms, secure new funding, or stabilize the client base despite adverse conditions.
Milestones That Will Clarify SPAR Group’s Strategic and Financial Trajectory
Quarterly revenue trends by service line and geography: stabilization or growth would suggest successful client retention and/or new business wins.
Gross margin trajectory: improvement would indicate either pricing power, operational efficiencies, or favorable service mix.
Adoption rates and client feedback for SPARView and analytics services, if disclosed, would help test whether technology investments are driving differentiation.
Resolution status and financial impact of the shareholder derivative litigation.
Changes to the credit facility structure or evidence of improved access to operational cash.
Client concentration metrics, if disclosed: high dependency on a few clients could increase vulnerability to contract losses.
New contract announcements or expansions in service scope with existing clients.
Working capital trends, especially days sales outstanding and cash conversion cycles, to gauge liquidity risk.
Disclaimer: This is research-only, informational analysis and not investment advice. It may include AI-generated interpretation and general industry context. Always verify important details using primary sources.

Comments